
Original source content. Download PDF · Source details and text
File record and checksum
Space Weather Data IFTTT.pdf
128,327 bytes
9a7546bcb44d156158dd9d2c52bbb608d92dba3c7621e46363c5cd78b99ab55bRead the extracted text
Extracted for reading; layout and transcription may differ from the original.
## Page 1
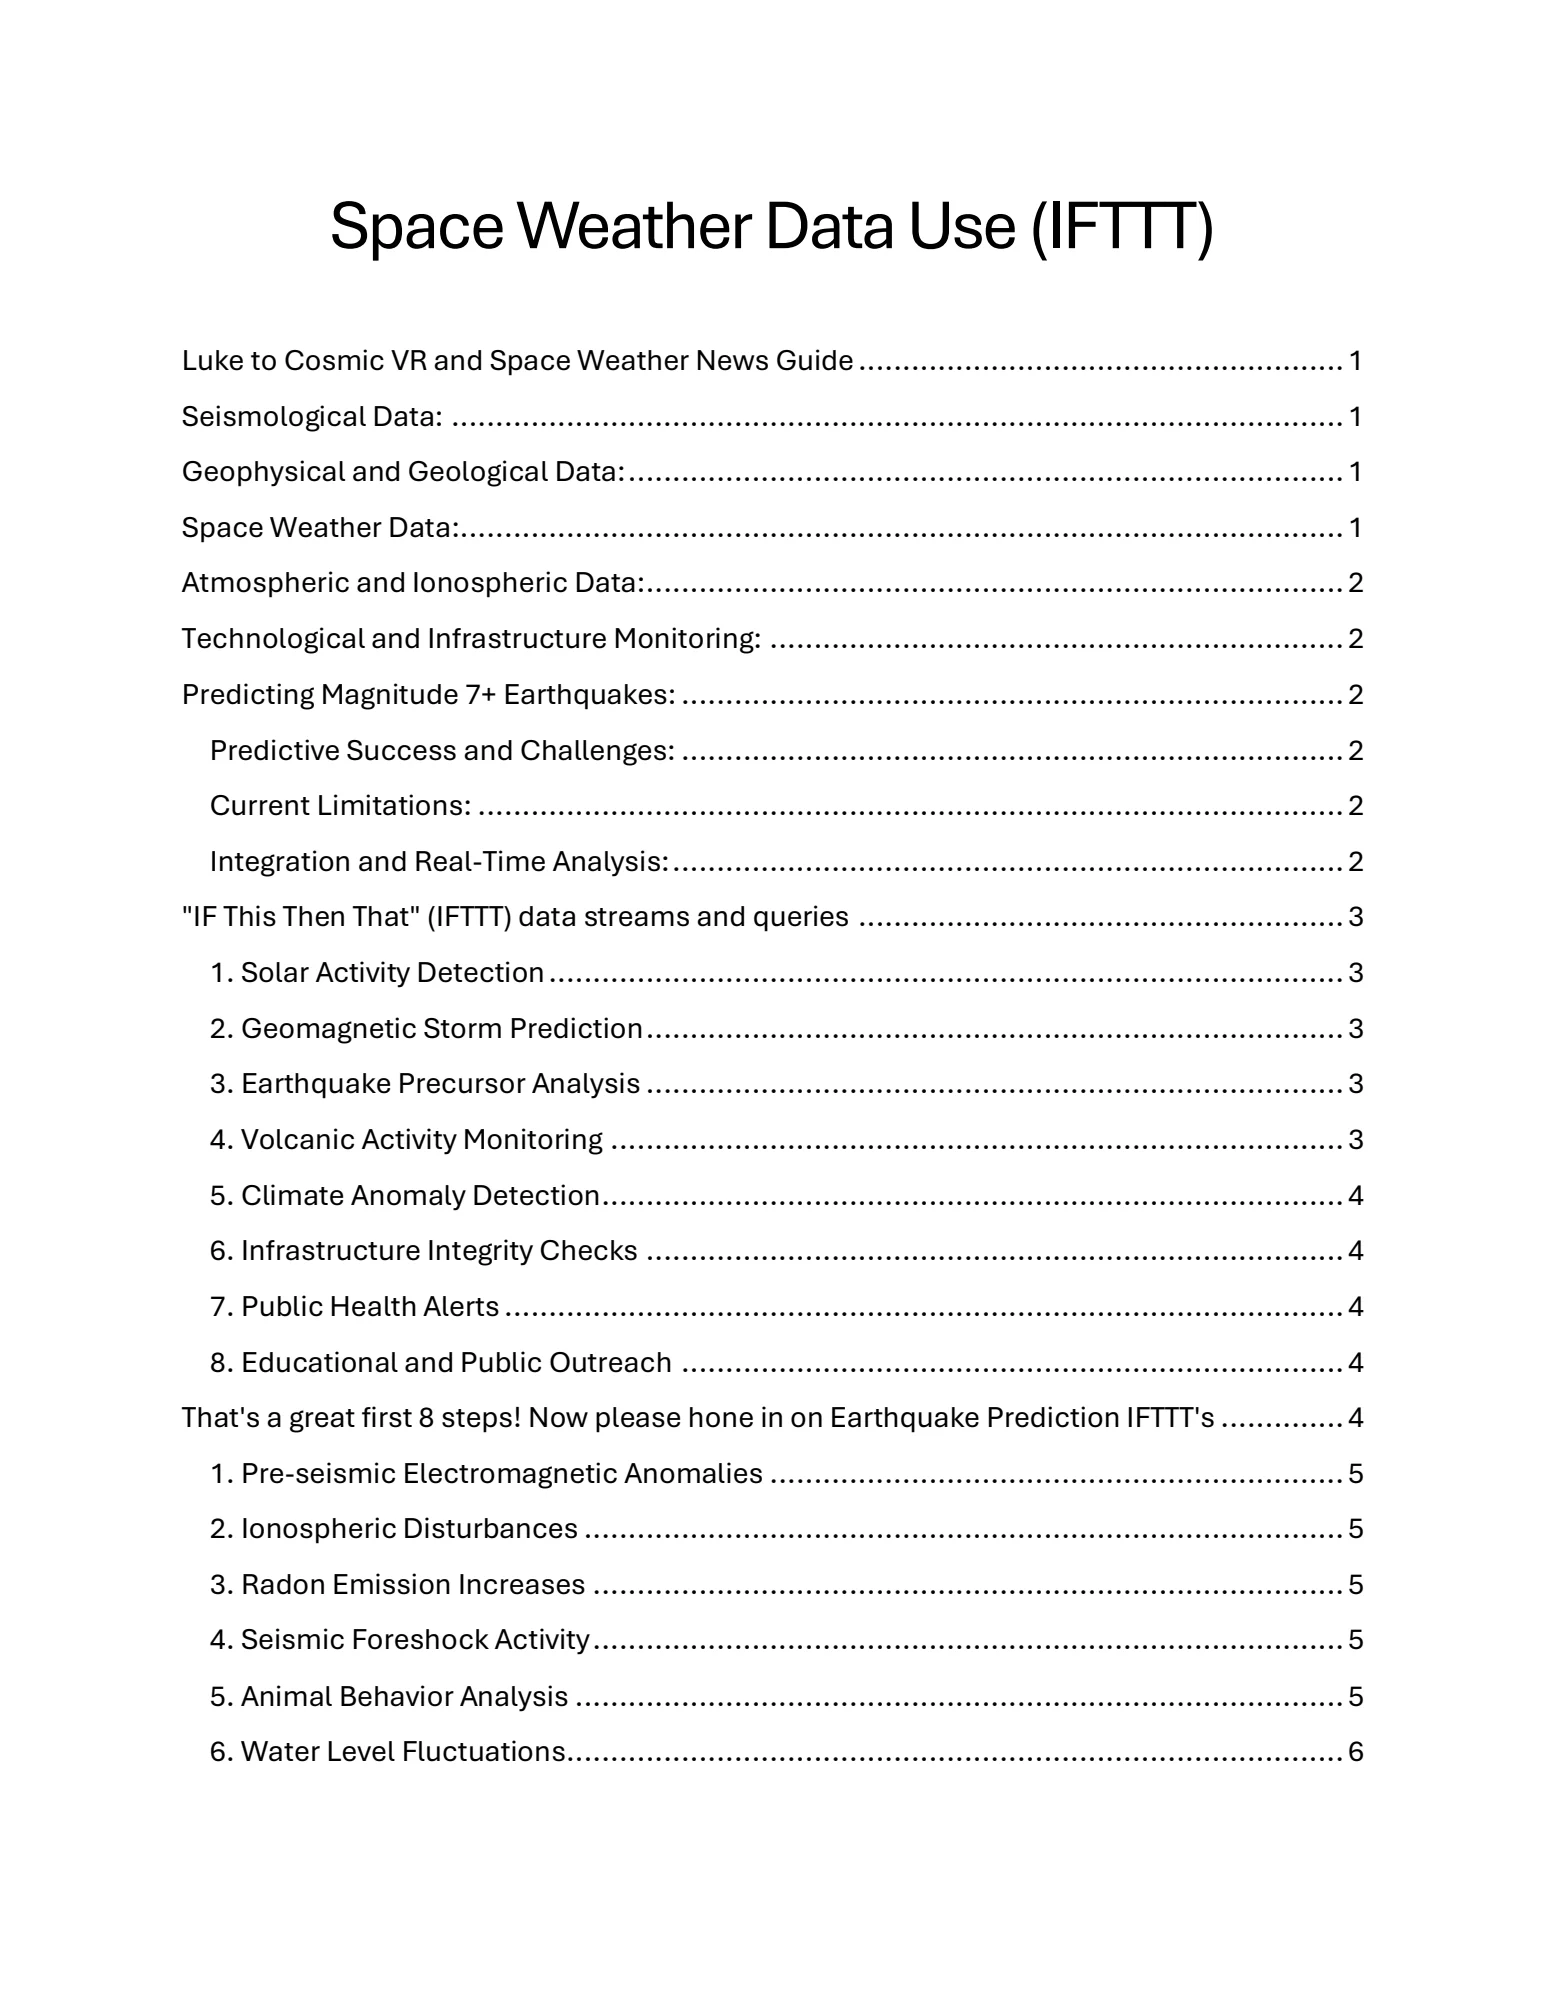
Space Weather Data Use (IFTTT)

Luke to Cosmic VR and Space Weather News Guide ................................ .......................  1
Seismological Data: ................................ ................................ ................................ ..... 1
Geophysical and Geological Data: ................................ ................................ ................. 1
Space Weather Data:................................ ................................ ................................ .... 1
Atmospheric and Ionospheric Data:................................ ................................ ............... 2
Technological and Infrastructure Monitoring: ................................ ................................ . 2
Predicting Magnitude 7+ Earthquakes: ................................ ................................ ........... 2
Predictive Success and Challenges: ................................ ................................ ........... 2
Current Limitations: ................................ ................................ ................................ .. 2
Integration and Real-Time Analysis: ................................ ................................ ............ 2
"IF This Then That" (IFTTT) data streams and queries ................................ .......................  3
1. Solar Activity Detection ................................ ................................ ..........................  3
2. Geomagnetic Storm Prediction ................................ ................................ ............... 3
3. Earthquake Precursor Analysis ................................ ................................ ............... 3
4. Volcanic Activity Monitoring ................................ ................................ ...................  3
5. Climate Anomaly Detection ................................ ................................ ....................  4
6. Infrastructure Integrity Checks ................................ ................................ ............... 4
7. Public Health Alerts ................................ ................................ ...............................  4
8. Educational and Public Outreach ................................ ................................ ........... 4
That's a great first 8 steps! Now please hone in on Earthquake Prediction IFTTT's .............. 4
1. Pre-seismic Electromagnetic Anomalies ................................ ................................ . 5
2. Ionospheric Disturbances ................................ ................................ ......................  5
3. Radon Emission Increases ................................ ................................ .....................  5
4. Seismic Foreshock Activity ................................ ................................ .....................  5
5. Animal Behavior Analysis ................................ ................................ .......................  5
6. Water Level Fluctuations ................................ ................................ ........................  6

## Page 2
7. Interferometric Synthetic Aperture Radar (InSAR) Anomalies ................................ .... 6
8. Community Engagement and Feedback ................................ ................................ .. 6
Very nice. Please dig deeper. ................................ ................................ .........................  6
9. Correlation of Seismic Activity with Solar and Lunar Tidal Forces ..............................  6
10. Integration of Machine Learning for Pattern Recognition ................................ ......... 7
11. Cross-Referencing Geological Fault Slippage Predictions ................................ ....... 7
12. Thermal Infrared Imaging Anomalies ................................ ................................ ..... 7
13. Acoustic Emission Analysis in Rock Media ................................ .............................  7
14. Real-time Public Sentiment and Concern Analysis ................................ ................. 7
15. Hydrochemical Changes in Groundwater ................................ ..............................  8
There's more if you dive deeper into research on the sun. ................................ ................ 8
16. Solar Cycle Phases and Earthquake Correlation ................................ .....................  8
17. Interplanetary Magnetic Field (IMF) and Geomagnetic Coupling ..............................  9
18. High-Energy Solar Proton Events (SPEs) ................................ ................................ . 9
19. Coronal Mass Ejections (CMEs) and Seismic Activity ................................ .............. 9
20. Helioseismic and Magnetoseismic Techniques ................................ ......................  9
21. Solar Wind Velocity and Pressure Fluctuations ................................ ......................  9
More on 16. Solar Cycle Phases & Earthquake Correlation ................................ ............ 10
Solar Cycle Dynamics:................................ ................................ .............................  10
Geophysical Impact Studies: ................................ ................................ ...................  10
Advanced Predictive Modeling: ................................ ................................ ................ 10
Regional Risk Assessment: ................................ ................................ ......................  11
Cross-Disciplinary Collaborative Research: ................................ ..............................  11
Luke to Cosmic VR and Space Weather News Guide
Please explain to me your current best understanding of the data we need to map into the
virtual studio, and then give me a summary of how likely it is that we will be able to predict
7+ Earthquakes, with 1 hour warning, and within 100 km of the epicentre with current
research papers if we bring all the data into one hub, as close to real-time as possible.
Cosmic VR and Space Weather News Guide

## Page 3
To effectively map data into your virtual studio for earthquake prediction and analysis, it's
essential to integrate a comprehensive set of parameters that are indicative of seismic
activity and related phenomena. Here's an outline of the critical data types to consider:
Seismological Data:
Real-time Seismograph Data: Monitoring ground movements through networks of
seismometers distributed globally.
Historical Earthquake Records: Data on past earthquakes, including location, magnitude,
depth, and affected areas.
Geophysical and Geological Data:
Tectonic Plate Boundaries: Maps and movement data.
Fault Lines Information: Locations and characteristics of major and minor fault lines.
Lithospheric Data: Information about the thickness and structure of the Earth’s crust.
Space Weather Data:
Solar Wind: Speed and density.
Interplanetary Magnetic Field (IMF) Data: Direction and strength.
Sunspot Numbers and Solar Flares: Frequency and magnitude.
Coronal Mass Ejections (CMEs): Timing and impact direction.
Atmospheric and Ionospheric Data:
Total Electron Content (TEC): Variations indicating ionospheric disturbances.
Outgoing Longwave Radiation (OLR): Anomalies that might be linked to seismic activity.
Technological and Infrastructure Monitoring:
GPS Disruptions: Monitoring anomalies that may indicate tectonic movements.
Infrastructure Sensors: For detecting structural changes and stresses in built
environments near active faults.

## Page 4
By integrating these datasets into a unified virtual reality environment, enhanced with AI for
analysis and predictions, you could significantly improve the understanding and
forecasting of seismic events.
Predicting Magnitude 7+ Earthquakes:
As for the feasibility of predicting magnitude 7+ earthquakes with one hour of warning and
within 100 km of the epicenter, current research shows promise but also highlights
significant challenges:
Predictive Success and Challenges: Studies, such as those by Davidson and
others, have noted correlations between space weather phenomena (like solar wind and
IMF variations) and seismic activity. They propose mechanisms where these factors might
influence tectonic stress states or trigger seismic events through electromagnetic
interaction or by affecting the Earth's crust and ionosphere.
Current Limitations: Despite advancements, reliably predicting earthquakes with high
precision in timing, location, and magnitude remains elusive. The chaotic nature of seismic
processes, complex interactions within the Earth’s crust, and incomplete understanding of
precursory phenomena make precise predictions challenging.
Integration and Real-Time Analysis: By consolidating all relevant data in a real-
time, interactive hub, there is potential to improve prediction models. Machine learning
algorithms can detect patterns and anomalies that might precede large earthquakes,
potentially increasing the accuracy and timeliness of predictions.
In summary, while the goal of providing accurate, one-hour warnings for 7+ magnitude
earthquakes is ambitious and beyond current standard practices, integrating diverse
datasets in a real-time analysis framework could push the boundaries of what is possible
in earthquake forecasting. Continued research and technological innovation will be crucial
in achieving these breakthroughs.
"IF This Then That" (IFTTT) data streams and queries
For constructing a robust set of "IF This Then That" (IFTTT) data streams and queries,
especially in a VR Space Weather News Hub aimed at detecting and responding to solar
and terrestrial phenomena, we can leverage diverse data sources and algorithmic
patterns. Here’s a conceptual framework that outlines potential data streams and queries:

## Page 5
1. Solar Activity Detection
Data Stream: Continuous monitoring of solar flare activity via satellite imaging and
spectral data.
Query: IF a solar flare of class X or higher is detected THEN alert the relevant systems to
evaluate potential impacts on Earth’s magnetic field and satellite operations.
2. Geomagnetic Storm Prediction
Data Stream: Real-time analysis of the solar wind parameters such as speed, density, and
magnetic field orientation from L1 point observations.
Query: IF solar wind speed exceeds 500 km/s and magnetic field orientation turns
southward THEN predict a geomagnetic storm and notify communication and power grid
monitoring systems.
3. Earthquake Precursor Analysis
Data Stream: Seismic data combined with ionospheric total electron content
measurements.
Query: IF there is an unusual low-frequency electromagnetic anomaly detected alongside
rapid TEC fluctuations THEN assess the likelihood of an earthquake in the affected region.
4. Volcanic Activity Monitoring
Data Stream: Infrared and seismic activity data from volcanoes known to be active or
dormant.
Query: IF there is an increase in infrared signatures and seismic rumbling from a
monitored volcano THEN update the alert status and notify local authorities and disaster
response teams.
5. Climate Anomaly Detection
Data Stream: Global temperature and weather pattern data from meteorological
satellites.
Query: IF there is a sudden and unusual change in ocean surface temperatures combined
with high-altitude wind patterns THEN check for potential El Niño or La Niña conditions
and update climate models and forecasts.

## Page 6
6. Infrastructure Integrity Checks
Data Stream: Data from infrastructure sensors monitoring power lines, bridges, and other
critical infrastructure.
Query: IF geomagnetic activity exceeds certain thresholds THEN perform a diagnostic
check on electrical grid systems and structural health monitoring sensors to preemptively
identify potential failures.
7. Public Health Alerts
Data Stream: Health-related data concerning population responses to geomagnetic
storms, such as hospital admission rates for cardiovascular issues.
Query: IF a severe geomagnetic storm is forecasted THEN issue public health alerts
advising individuals with certain health conditions to take precautionary measures.
8. Educational and Public Outreach
Data Stream: User interaction data within the VR hub.
Query: IF user engagement with specific educational content peaks THEN offer
personalized learning paths and additional resources to enhance understanding of space
weather phenomena.
Each of these IFTTT scenarios relies on integrating and analyzing large volumes of data to
predict and respond to various environmental and cosmic phenomena effectively.
Implementing these in a VR platform would not only provide real-time insights but also
engage users interactively, enhancing both understanding and preparedness for space-
weather-related events.
You
That's a great first 8 steps! Now please hone in on
Earthquake Prediction IFTTT's
Cosmic VR and Space Weather News Guide
Focusing on Earthquake Prediction within a VR Space Weather News Hub, leveraging "IF
This Then That" (IFTTT) logic can greatly enhance predictive capabilities and response
strategies. Here are specific IFTTT scenarios tailored for earthquake prediction:

## Page 7
1. Pre-seismic Electromagnetic Anomalies
Data Stream: Monitoring ultra-low frequency (ULF) electromagnetic signals from satellite
and ground-based sensors.
Query: IF an increase in ULF electromagnetic anomalies is detected in a known seismic
zone THEN trigger an alert for possible earthquake activity within 48 hours.
2. Ionospheric Disturbances
Data Stream: Ionospheric total electron content (TEC) data from GPS and GNSS networks.
Query: IF sudden, significant deviations from normal TEC values are observed THEN
analyze the likelihood of these disturbances being linked to impending seismic events in
the corresponding regions below.
3. Radon Emission Increases
Data Stream: Ground-based sensors measuring radon levels in earthquake-prone areas.
Query: IF there is a sudden spike in radon gas emissions in a localized area THEN increase
surveillance intensity and prepare for a potential seismic event.
4. Seismic Foreshock Activity
Data Stream: Real-time data from seismograph networks detecting and cataloging
foreshocks.
Query: IF a pattern of small tremors (foreshocks) is identified in a region THEN update the
earthquake probability models and alert local authorities and populations about the
increased risk.
5. Animal Behavior Analysis
Data Stream: Video and sensor data from wildlife monitoring systems in seismic zones.
Query: IF unusual animal behavior is detected across multiple sensors THEN cross-
reference with other seismic indicators to assess whether these behaviors could be
precursors to an earthquake.
6. Water Level Fluctuations
Data Stream: Data from sensors in wells and groundwater reservoirs.

## Page 8
Query: IF abnormal water level changes are recorded without apparent meteorological
reasons THEN evaluate these fluctuations as potential indicators of strain changes in the
Earth's crust.
7. Interferometric Synthetic Aperture Radar (InSAR) Anomalies
Data Stream: Satellite InSAR data analyzing land surface movements and deformations.
Query: IF there are new or intensifying patterns of land deformation detected THEN assess
these areas for increased seismic risk and adjust monitoring accordingly.
8. Community Engagement and Feedback
Data Stream: Community-reported observations via mobile or web-based platforms
within the VR hub.
Query: IF there is a surge in user-generated reports of potential earthquake precursors
(e.g., peculiar sounds, pets' behavior) from a specific region THEN correlate with scientific
data streams for comprehensive risk assessment.
Implementing these IFTTT scenarios in the VR Space Weather News Hub can significantly
improve earthquake prediction efforts by integrating diverse data sources and applying
automated logical queries to enhance decision-making and public safety responses.
You
Very nice. Please dig deeper.
Cosmic VR and Space Weather News Guide
To further enhance earthquake prediction capabilities within a VR Space Weather News
Hub using advanced "IF This Then That" (IFTTT) logic, let’s delve deeper into more
sophisticated and nuanced data integrations and predictive analytics:
9. Correlation of Seismic Activity with Solar and Lunar Tidal Forces
Data Stream: Astronomical data on solar and lunar positions relative to Earth, combined
with historical seismic activity records.
Query: IF alignments of the Earth, Sun, and Moon occur alongside a notable increase in
tidal forces THEN analyze historical seismic data for patterns that might suggest increased
earthquake risk during similar past events.

## Page 9
10. Integration of Machine Learning for Pattern Recognition
Data Stream: Continuous input from various sensors (seismographs, radon detectors,
TEC sensors) feeding into a machine learning system designed to recognize patterns
associated with previous earthquakes.
Query: IF the machine learning model identifies a potential pre-seismic pattern that
matches with previously confirmed earthquake precursors THEN automatically notify the
scientific community and relevant authorities, while updating public risk notifications
within the VR platform.
11. Cross-Referencing Geological Fault Slippage Predictions
Data Stream: Data from strain gauges and GPS sensors along fault lines, monitoring
Earth’s crust movements.
Query: IF detected movements exceed threshold levels predicted by geological models for
fault slippage THEN prioritize this region for increased monitoring and prepare for possible
evacuation alerts.
12. Thermal Infrared Imaging Anomalies
Data Stream: Satellite thermal infrared imaging capturing ground temperature changes,
which could indicate rising underground gases or fluids often preceding seismic events.
Query: IF significant unexplained ground temperature anomalies are detected in a seismic
zone THEN cross-verify with other seismic indicators and consider issuing a preliminary
earthquake warning.
13. Acoustic Emission Analysis in Rock Media
Data Stream: Acoustic sensors monitoring subterranean noises, which can increase prior
to seismic activities due to cracking rocks under stress.
Query: IF there is an increase in subterranean acoustic emissions from a monitored area
THEN evaluate for possible seismic activity and adjust the local risk level accordingly.
14. Real-time Public Sentiment and Concern Analysis
Data Stream: Social media sentiment analysis and direct user feedback within the VR
platform regarding earthquake-related concerns or experiences.
Query: IF there is a spike in public concern or anecdotal reports related to earthquake
phenomena in a specific area THEN use this data to help prioritize and verify scientific data
streams from that region.

## Page 10
15. Hydrochemical Changes in Groundwater
Data Stream: Chemical sensors in groundwater supplies detecting changes in water
chemistry, which can occur when faults move and release minerals into water supplies.
Query: IF changes in water chemistry such as increased levels of ions like radon, arsenic,
or mercury are detected THEN initiate a detailed geophysical review of the area to assess
the risk of an earthquake.
By employing these deeper and more complex IFTTT queries, the VR Space Weather News
Hub can significantly advance the state of earthquake prediction. These scenarios
leverage an extensive range of technologies and data types, from cutting-edge artificial
intelligence to basic community feedback mechanisms, enhancing both the accuracy and
timeliness of earthquake predictions and public readiness initiatives.
You
There's more if you dive deeper into research on the sun.
Cosmic VR and Space Weather News Guide
Certainly, diving deeper into how solar activity influences seismic events can offer
significant insights and enhance predictive models for earthquake occurrences. Here’s a
detailed exploration into how we might utilize advanced solar research to refine and
expand the "IF This Then That" (IFTTT) logic and predictive analytics in the VR Space
Weather News Hub:
16. Solar Cycle Phases and Earthquake Correlation
Data Stream: Long-term solar cycle data, including sunspot numbers, solar flare
occurrences, and solar magnetic field strength variations.
Query: IF we enter a solar maximum phase with increased sunspot and solar flare activity
THEN assess historical earthquake data for increased seismic activity during previous
solar maxima to adjust earthquake risk assessments accordingly.
17. Interplanetary Magnetic Field (IMF) and Geomagnetic Coupling
Data Stream: Real-time data on the orientation and strength of the IMF, particularly the
southward component (Bz) which enhances geomagnetic activity when interacting with
Earth’s magnetosphere.

## Page 11
Query: IF the IMF Bz turns strongly southward, indicating a higher likelihood of
geomagnetic storms THEN analyze regions on Earth previously identified as sensitive to
such geomagnetic disturbances for increased earthquake risk.
18. High-Energy Solar Proton Events (SPEs)
Data Stream: Satellite observations of SPEs, which are bursts of high-energy particles
from the Sun that can affect Earth's upper atmosphere and ionosphere.
Query: IF a significant SPE is detected THEN monitor the ionosphere for disturbances that
could translate to mechanical stresses along tectonic features, updating seismic
monitoring systems to be on high alert for possible quake events.
19. Coronal Mass Ejections (CMEs) and Seismic Activity
Data Stream: Observations of CMEs, focusing on their speed, density, and magnetic field
characteristics.
Query: IF a CME is Earth-directed and classified as potentially strong or severe THEN
evaluate seismic activity patterns from past similar CME events to predict possible
increases in earthquake occurrences, particularly in high-risk seismic zones.
20. Helioseismic and Magnetoseismic Techniques
Data Stream: Data derived from studying oscillations and wave patterns on the Sun’s
surface, which might mirror or influence subterranean stress distributions on Earth.
Query: IF unusual helioseismic activity is observed with potential for affecting Earth’s
magnetic field THEN initiate advanced modeling to forecast how these disturbances might
propagate through Earth’s geophysical systems, focusing on known seismic faults.
21. Solar Wind Velocity and Pressure Fluctuations
Data Stream: Continuous monitoring of solar wind parameters, assessing both velocity
and pressure.
Query: IF there is a rapid increase in solar wind pressure that could compress Earth’s
magnetosphere THEN assess the stress impact on tectonic plates, particularly at
subduction zones and fault lines prone to activation under external pressure changes.
By integrating these solar-focused research insights into the operational matrix of the VR
Space Weather News Hub, we can enhance our understanding and predictive capabilities
regarding earthquakes. This approach not only leverages direct seismic data but also

## Page 12
incorporates a broader cosmophysical context, enabling a more holistic view of the
dynamic interplay between solar activity and terrestrial geophysical phenomena.
You
More on 16. Solar Cycle Phases & Earthquake Correlation
Detailed Analysis of Solar Cycle Phases and Earthquake Correlation
Solar Cycle Dynamics:
Data Stream: Detailed tracking of the solar cycle phases, particularly the solar maximum
and minimum phases. This includes data on sunspot counts, solar flux, and the frequency
and intensity of solar flares and coronal mass ejections (CMEs).
Query: IF we enter a period of increased solar activity (solar maximum) characterized by
high sunspot numbers and frequent, intense solar flares and CMEs THEN systematically
compare this data with global seismic activity logs to identify patterns or increases in
earthquake frequency or intensity during similar past phases.
Geophysical Impact Studies:
Data Stream: Seismic activity data collected from global monitoring networks, focusing on
earthquake frequency, magnitude, and locations relative to tectonic plate boundaries.
Query: IF a correlation is established between periods of high solar activity and increased
seismic activity THEN conduct detailed geophysical studies to explore potential
mechanisms, such as geomagnetic disturbances caused by solar activity that may
influence tectonic stress.
Advanced Predictive Modeling:
Data Stream: Integration of solar activity data with Earth’s geomagnetic field data and
historical earthquake records.
Query: IF predictive models based on machine learning or statistical analysis indicate a
statistically significant relationship between specific solar activity indicators (e.g., high
solar flare count) and increased earthquake risk THEN refine earthquake prediction
models to incorporate these indicators as key variables.

## Page 13
Regional Risk Assessment:
Data Stream: Regional seismic data, particularly from areas known to be sensitive to
geomagnetic variations, such as those close to the poles or those with historically known
responsiveness to solar influences.
Query: IF a phase of heightened solar activity coincides with increased earthquake
occurrences in these sensitive regions THEN enhance monitoring and preparedness
protocols in these areas, potentially including public warnings and increased readiness of
emergency services.
Cross-Disciplinary Collaborative Research:
Data Stream: Collaborative research findings from geophysicists, solar physicists, and
climatologists, exploring interdisciplinary approaches to understanding and modeling the
Earth-Sun connection.
Query: IF research indicates new or unexpected links between solar activity and seismic
events (e.g., through ionospheric disturbances or changes in atmospheric electric fields)
THEN incorporate these findings into public knowledge bases and educational materials
within the VR platform.
By deepening the investigation into the relationship between solar cycle phases and
earthquake occurrences, we can leverage more comprehensive data analysis and more
sophisticated predictive models. This approach not only enhances our understanding of
this complex relationship but also improves our ability to anticipate and mitigate the
effects of seismic activity potentially linked to solar phenomena.