
Manufacturing servicing and industrial capacity in Australia and the world
Prepared for Luke Nathan Hayes on 7 November 2026
Executive summary
The United States and China are driving an industrial expansion that Australia must meet with its own manufacturing, materials, power and defensive capability. These 7 November 2026 estimates compare projected need with current production and size an Australian robot industry for domestic use and export.
Machines and materials
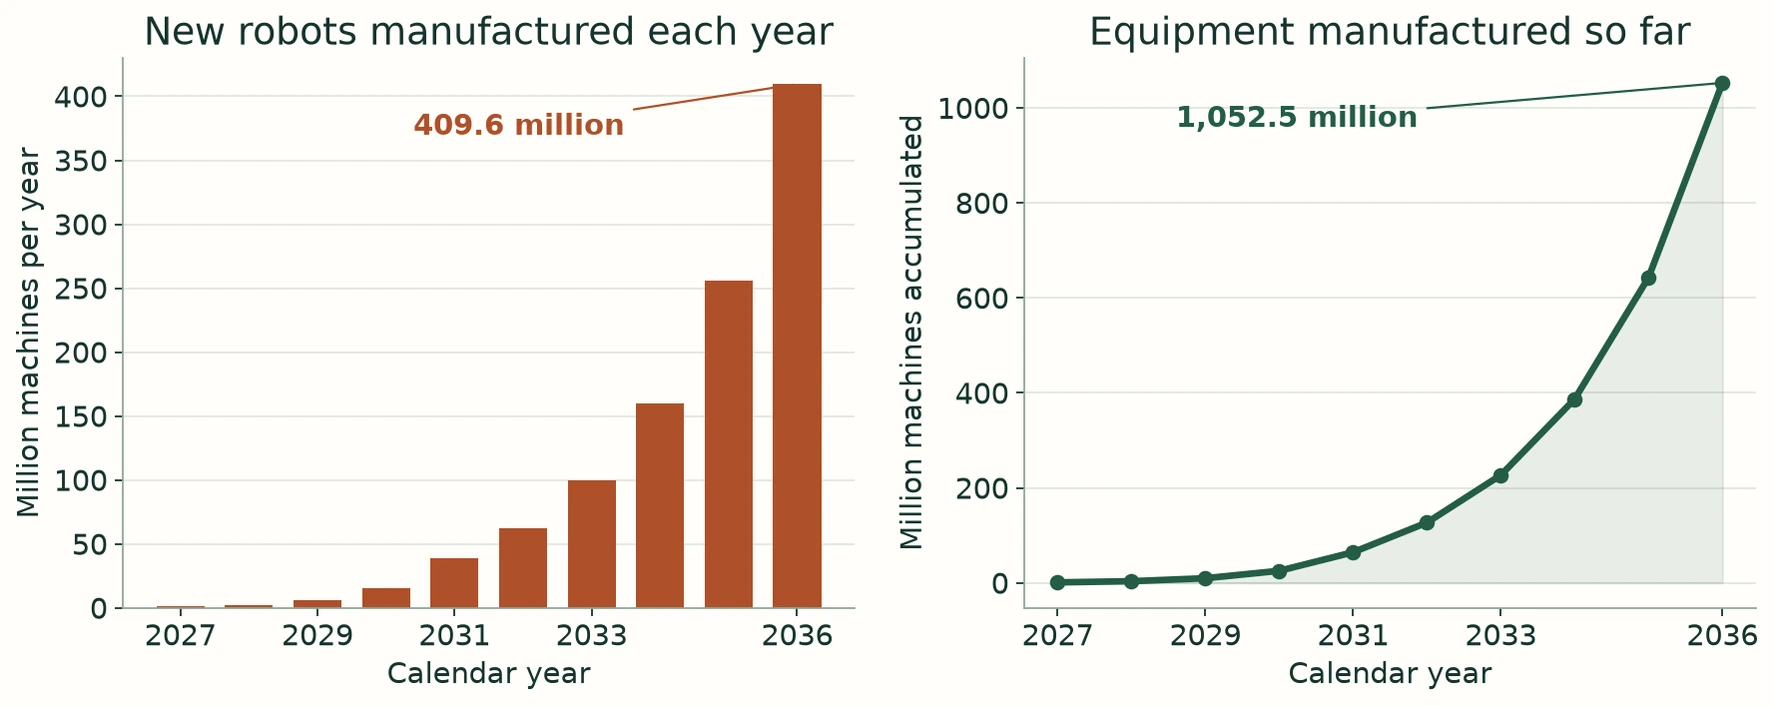
Accelerated robot case: 409.6 million newly manufactured during 2036; 1,052,537,500 manufactured cumulatively during 2027 to 2036. Operating fleet = accumulated manufacture minus permanent retirements. One billion remain operating if no more than 52.5 million of those machines leave service. That places this path around the scale of Musk's September 2026 prediction of more than a billion operating within ten years. At 60 kilograms each, the 2031 batch contains 2.34 billion kilograms; the 2036 batch contains 24.6 billion. Repair and safer automated operation can preserve that equipment for longer service.
Copper: the January 2026 market outlook grows with power, transport and wider industry. Interpolating it gives 38.8 million tonnes of annual use in 2036. The accelerated robot batch adds 1.64 million to 3.28 million tonnes, taking end use to 40.4 million to 42.1 million, up from 28 million in 2025. Robot factory feed is 1.72 million to 3.45 million tonnes at 95 per cent yield. Half secondary feed leaves 862,000 tonnes to 1.72 million tonnes of primary copper, compared with Australia's 730,000 tonne annual mine output in 2025. Dated market outlook; Australian production.
Aluminium: total annual use reaches 139.6 million to 142.9 million tonnes in the 2036 market extension plus robot case, against 106 million in the July 2025 outlook's starting year. Recycling and primary smelting grow separately. The robot primary addition is 3.66 million to 5.39 million tonnes, or six to nine Tomago-sized annual outputs. With the base-market gap filled through different primary and secondary mixes, world primary output needs 82.2 million to 88.1 million tonnes, against 74 million produced and 79.7 million of installed capacity in 2025. Market and supply outlook; USGS benchmarks.
Rare earth magnets: 2036 reference motors contain 246,000 to 369,000 tonnes of neodymium and praseodymium, or NdPr. Avoiding 90 per cent with other motors leaves 24,600 to 36,900 tonnes, four to six times Lynas's observed annual metal content of 6,220 tonnes through its Australia-Malaysia chain. Australia's planned Eneabba and Nolans refineries represent another roughly 7,000 tonnes annually as they ramp. August 2026 operating output; Iluka November 2026; Nolans plans.
Power and the delivery pipeline
New clean supply must cover fossil replacement and essential growth alongside compute and robots. Any shortfall requires more generation. Ground computing used an estimated 485 terawatt-hours in 2025. The following scenarios assume 80 per cent average equipment load and 20 per cent facility overhead. Racks use a 1.47 tonne, 120 kilowatt reference. Australia generated 286.8 terawatt-hours in 2025. International Energy Agency April 2026 estimate; Australian 2026 statistics.
At 14.4 per cent annual electricity growth, 2036 consumption is 2,130 terawatt-hours, or 7.4 Australias. That year's net capacity addition is 32 gigawatts, housing 391,000 tonnes of additional racks.
At 20 per cent growth, 2036 consumption is 3,600 terawatt-hours, or 12.6 Australias. The annual addition is 71 gigawatts, housing 876,000 tonnes of additional racks.
At 30 per cent growth, 2036 consumption is 8,690 terawatt-hours, or 30.3 Australias. The annual addition is 239 gigawatts, housing 2.93 million tonnes of additional racks.
In October 2026, the Australian Energy Market Operator, AEMO, reported 80.9 gigawatts of generation and storage in the main grid's connection process, against 77 installed on that basis. The September quarter saw 4.5 gigawatts receive application approval and 1.3 reach full output. Berkeley Lab's June 2026 study recorded US applications for 1,312 gigawatts of generation and 749 of storage at the end of 2025; 549 had draft or executed connection agreements. Storage is separate from generation. AEMO October 2026; Berkeley Lab June 2026.
Globally, 2025 additions included about 511 gigawatts of solar, while the IEA's 2026 review reports 78 gigawatts of nuclear under construction. Supplying 100 gigawatts of rated computing from solar at a chosen 25 per cent capacity factor requires about 384 gigawatts of panels for annual energy, plus a design for delivery timing. With 65 per cent of energy stored and 90.25 per cent round-trip efficiency, that solar rating rises to about 411 gigawatts. A four-hour full-load buffer delivering 480 gigawatt-hours needs about 561 nominal at 90 per cent usable reserve and 95 per cent discharge efficiency, containing roughly 51,400 tonnes of cathode lithium. IRENA March 2026; IEA nuclear construction; updated mineral production.
Orbital computing carries its power supply. The engineering ramp commissions 0.5, 5.5, 55, 250 and 300 gigawatts during 2027, 2028, 2029, 2031 and 2036. At an assumed 10,000 tonnes per gigawatt, the 2036 batch is three million tonnes and 30,000 payload flights at 100 tonnes delivered per flight. Better output per tonne reduces those requirements. SpaceX June 2026 ambition.
Australian scale: Hayes's 7 November 2026 brief specifies a 20-million-person closed-loop Quandamooka city, an Australia of 100 million-plus by 2045 and a worldwide network. At selected space allowances, the city needs six billion cubic metres, averaging 316 million annually over 19 years. At five per cent food-energy conversion plus 1,000 other watts per resident, operation needs 599 terawatt-hours annually. These are adjustable design tests. The earlier 1.687-million annual Australian robot ramp is modest, with an assumed throughput discount. Useful housing, transport, energy and industry activate the larger programme early. 2045 calculations; generation city design.
The physical task
Super Intelligence, abbreviated here to SI, could accelerate the design and operation of computers, robots, energy systems and the factories that build them. This paper estimates the material requirements of that expansion over one, two, three, five and ten years from November 2026. It follows the physical chain from finished equipment through manufacturing, refining and source minerals, with comparisons to existing global and Australian industry.
The central opportunity is to build a growing stock of useful, repairable machines. New factories add robots and computing capacity. Workshops keep existing equipment working through worn-part replacement, refurbishment and processor upgrades. Better designs can increase the work delivered by each kilogram of material. Faster mining and refining can increase the material available to build the next generation.
Power is a major constraint on deployment. A chip factory can deliver processors before a suitable site has electricity, cooling and a connection ready for them. Governments and companies are responding with generation projects, storage, grid upgrades, nuclear development and new technologies. Space-based computing adds another route, carrying its power generation into orbit. Power beaming could connect separate generators and users. These developments change both the scale and the composition of material demand.
Power networks, transport, housing, water supply and ordinary industry expand alongside robots and computing. Their material requirements belong in the same plan. The United Nations Sustainable Development Goals, introduced below, reinforce the need to extend these services to more people. The calculations were rebuilt on 7 November 2026. They report the mass in manufactured equipment directly, then add specified service work and infrastructure. Source dates remain attached to reported production, applications, approvals and company targets. Future quantities are conditional estimates using the assumptions stated beside them.
Manufactured equipment and the operating fleet
The accelerated manufacturing scenario produces about 39.1 million robots during 2031. At an assumed 60 kilograms each, those machines contain about 2.34 billion kilograms of finished equipment, or 2.34 million tonnes. That is the material in the batch manufactured that year. It remains a productive asset for as long as the machines and their components stay useful.
An Australian mass comparison helps picture it. Rio Tinto's 13 July 2018 report of its first autonomous Pilbara delivery describes a train carrying about 28,000 tonnes of iron ore. The 2031 robot batch has the same mass as about 84 of those trainloads. This compares weight; robots occupy different space and require different transport arrangements.
A million kilograms is 1,000 tonnes. A billion kilograms is one million tonnes. Mass tells us the quantity of material. Volume also needs its density: a tonne of copper takes much less space than a tonne of aluminium. The metal-volume examples later in the paper supply both the density and the dimensions of the comparison.
Annual manufacturing and accumulated equipment answer different questions. Annual manufacturing determines that year's new material requirement. Accumulated manufacturing tells us how much equipment has been produced over several years. Equipment still in service is accumulated production less actual final retirements. A service job changes selected components within that base.
For 2031, the direct formula is 39,062,500 robots × 60 kilograms per robot = 2,343,750,000 kilograms of complete equipment.
For 2036, annual manufacturing is 409.6 million robots. Accumulated manufacturing from 2027 to 2036 is 1,052,537,500 robots. The operating fleet equals that accumulated production minus permanent retirements, plus any machines already operating before 2027. Counting the newly manufactured machines alone, one billion remain in use if no more than 52,537,500 have permanently left service.
Musk's 1 September 2026 prediction concerns more than one billion humanoid robots operating within ten years. The comparable figure in this model is the accumulated equipment still in service. Its 410 million annual factory output is a different measure. The manufacturing path is therefore around the scale of his fleet prediction, conditional on actual retention and repair.
The material in one robot
Published designs vary. The Unitree G1 page checked on 6 November 2026 gives a mass of about 35 kilograms including its battery. Apptronik's 2023 Apollo specifications give 160 pounds, approximately 72.6 kilograms. The calculations use 60 kilograms as a clear whole-machine example within that product range.

CRU's 2025 component analysis, checked on 6 November 2026, estimates 4 to 8 kilograms of copper and 17 to 25 kilograms of aluminium per humanoid robot. The following material calculations use those published ranges. A particular design still needs a measured inventory whose parts add up to its complete mass.
CRU's 2026 magnet analysis, checked on 5 November 2026, estimates 2 to 3 kilograms of neodymium-based magnets per humanoid. A 7 November assumption assigns 30 per cent of that alloy mass to neodymium and praseodymium combined, abbreviated NdPr. That gives 0.6 to 0.9 kilograms of NdPr per robot. The iron-magnet section tests how another motor design changes this requirement.
The Duke Humanoid V2 public bill of materials dated 19 September 2026 shows how to make the inventory auditable. It identifies 31 actuators, the computer, battery, cameras, machined components and other parts, with links between components and their place on the robot. Weighing those assemblies and obtaining supplier material declarations would connect each service job to its copper, aluminium, magnets and electronics.
Trace materials such as tin, tantalum, tungsten and silver need that same component evidence. Semiconductor production also needs high-purity inputs and specialised processing. Their requirement will follow the actual circuit boards, chips and manufacturing routes selected for each design.
Existing global and Australian production
The mine benchmarks below come from Geoscience Australia's preliminary tables updated on 12 October 2026, which reconcile 2025 production with Australian data. Copper refining and aluminium smelting use the US Geological Survey's 2026 compilation, revised on 27 May 2026. These dated output figures show the scale of existing industry. Spare capacity requires a separate assessment of plants, feed, electricity and customer commitments.
Copper: world mines produced about 23 million tonnes of contained copper during 2025; Australian mines produced 730,000 tonnes. World refineries produced about 29 million tonnes, including metal from recycled feed.
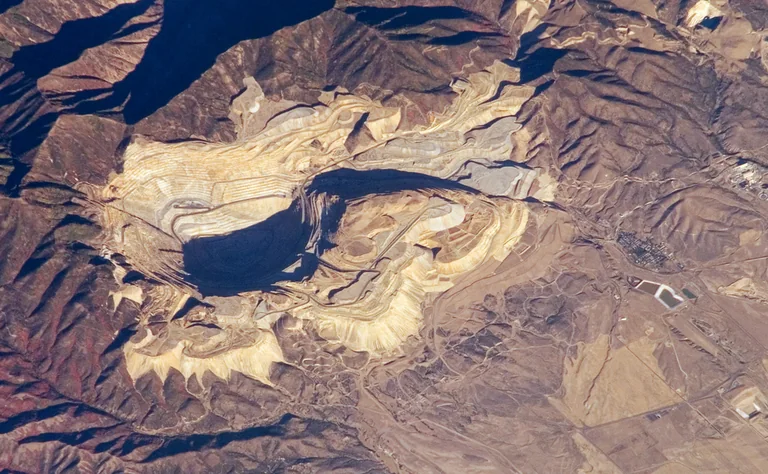

Aluminium: world primary smelters produced about 74 million tonnes in 2025. Australia produced 1.57 million tonnes from four smelters, according to the Australian Aluminium Council. World installed annual smelter capacity was about 79.7 million tonnes.
Bauxite: world mine output was about 450 million tonnes in 2025; Australian output was 102.5 million tonnes. This is ore for the aluminium chain.
Iron: world mine output contained about 1.6 billion tonnes of iron in 2025; Australian output contained 596 million tonnes. Australia produced about 961 million tonnes of iron ore by bulk mass.
Lithium: the updated 2025 figures are about 314,000 tonnes worldwide and 118,000 tonnes in Australia, expressed as contained lithium. Geoscience Australia derives its Australian estimate from concentrate production and assumed lithium oxide content.
Graphite and rare earths: world natural graphite mine output was about 1.8 million tonnes in 2025; Australia recorded no production. Total rare earth oxide mine output was about 390,000 tonnes worldwide and 34,000 tonnes in Australia. NdPr is a specified portion of that mixed oxide output.
The Australian Aluminium Council's 2025 production figure, checked on 7 November 2026, is 1.57 million tonnes from four smelters. Australia's bauxite mines, alumina refineries and metal smelters are successive stages. Large ore output gives Australia a strong starting position; additional finished-metal output needs processing and electricity as well.
USGS estimates world primary aluminium smelting capacity at about 79.7 million tonnes annually at the end of 2025, against actual output of about 74 million tonnes. The nominal difference is 5.7 million tonnes annually. Bringing unused capacity into production depends on its location, operating condition and electricity supply. New plant and recycled metal can add further output.
For a named Australian plant, Tomago's company description checked on 7 November 2026 gives annual production of about 590,000 tonnes. Later comparisons use that figure so the reader can picture the requirement in terms of an existing Australian smelter.
Five manufacturing horizons
The global production scenarios were constructed on 5 November 2026 and recalculated on 7 November. The delayed path assumes slower deployment, the replicated path assumes factories expand through replication, and the accelerated path tests faster compound growth. The annual rates and starting points are recorded at the end of the paper. They are planning hypotheses.
Each horizon below states annual robot output, the complete mass of that year's accelerated batch at 60 kilograms per robot, and its estimated copper and aluminium. Material comparisons use the 2025 production benchmarks above. Service parts and factory losses are calculated separately.
2027
Annual manufacturing is 100,000 robots in the delayed path, 500,000 in the replicated path and 1 million in the accelerated path. At 60 kilograms each, the accelerated batch contains 60 million kilograms of equipment, or 60,000 tonnes.
That batch contains 4,000 to 8,000 tonnes of copper, equivalent to 0.0138 to 0.0276 per cent of world copper refining output in 2025. Its 17,000 to 25,000 tonnes of aluminium equal 1.08 to 1.59 per cent of Australia's 2025 primary aluminium output. These are finished materials before factory losses and secondary supply.
2028
Annual manufacturing is 150,000 robots in the delayed path, 1 million in the replicated path and 2.5 million in the accelerated path. At 60 kilograms each, the accelerated batch contains 150 million kilograms of equipment, or 150,000 tonnes.
That batch contains 10,000 to 20,000 tonnes of copper, equivalent to 0.0345 to 0.069 per cent of world copper refining output in 2025. Its 42,500 to 62,500 tonnes of aluminium equal 2.71 to 3.98 per cent of Australia's 2025 primary aluminium output. These are finished materials before factory losses and secondary supply.
2029
Annual manufacturing is 225,000 robots in the delayed path, 2 million in the replicated path and 6.25 million in the accelerated path. At 60 kilograms each, the accelerated batch contains 375 million kilograms of equipment, or 375,000 tonnes.
That batch contains 25,000 to 50,000 tonnes of copper, equivalent to 0.0862 to 0.172 per cent of world copper refining output in 2025. Its 106,000 to 156,000 tonnes of aluminium equal 6.77 to 9.95 per cent of Australia's 2025 primary aluminium output. These are finished materials before factory losses and secondary supply.
2031
Annual manufacturing is 506,000 robots in the delayed path, 8 million in the replicated path and 39.1 million in the accelerated path. At 60 kilograms each, the accelerated batch contains 2.34 billion kilograms of equipment, or 2.34 million tonnes.
That batch contains 156,000 to 312,000 tonnes of copper, equivalent to 0.539 to 1.08 per cent of world copper refining output in 2025. Its 664,000 to 977,000 tonnes of aluminium equal 42.3 to 62.2 per cent of Australia's 2025 primary aluminium output. These are finished materials before factory losses and secondary supply.
2036
Annual manufacturing is 1.54 million robots in the delayed path, 60.8 million in the replicated path and 410 million in the accelerated path. At 60 kilograms each, the accelerated batch contains 24.6 billion kilograms of equipment, or 24.6 million tonnes.
That batch contains 1.64 million to 3.28 million tonnes of copper, equivalent to 5.65 to 11.3 per cent of world copper refining output in 2025. Its 6.96 million to 10.2 million tonnes of aluminium equal 4.44 to 6.52 times Australia's 2025 primary aluminium output. These are finished materials before factory losses and secondary supply.
Across 2027 to 2036, the accelerated path manufactures about 1.05 billion robots. At 60 kilograms each, that is approximately 63.2 billion kilograms, or 63.2 million tonnes, of complete equipment produced over the decade. The number still working in 2036 depends on their actual service histories. Useful old machines continue contributing to that stock.
Required feed and additional industrial capacity
Growing power systems, transport, construction and industry form the demand base for the robot expansion. The following 7 November calculations use published market outlooks, then identify the additional accelerated robot batch of 409.6 million machines in 2036. Every quantity below is an annual flow.
Development creates demand across the economy
The United Nations 2030 Agenda, adopted on 25 September 2015, sets Sustainable Development Goals for water and sanitation, energy access, industry and infrastructure, sustainable communities and resource efficiency. These are commonly called the UN SDGs. Meeting them involves pumps, pipes, power lines, generation, transport, buildings and equipment. The UN's 7 July 2026 progress report calls for greater investment and a faster energy transition. Project funding and delivery determine the quantities built.
Think of a new Australian suburb. It needs houses, water, sewerage, roads, transformers and communications together. A robot factory is one more customer for the metals used in those systems. The same applies when a town in another country gains reliable electricity or water for the first time. These needs grow alongside the industrial expansion examined here.
Copper demand and factory feed
S and P Global's 8 January 2026 copper study projects total annual use of about 28 million tonnes in 2025, 33 million in 2030, 38 million in 2035 and 42 million in 2040. Its main total includes economic activity, energy systems, AI and data centres, and defence; humanoid manufacturing is discussed separately. A straight interpolation between its 2035 and 2040 figures gives a 2036 market base of 38.8 million tonnes. That interpolation is this paper's 7 November calculation.
409.6 million robots × 4 to 8 kilograms of copper each = 1.64 million to 3.28 million tonnes in finished robots. Adding that batch gives total annual end use of 40.4 million to 42.1 million tonnes in 2036, compared with 28 million in the study's 2025 demand base. The increase is 12.4 million to 14.1 million tonnes, or 44 to 50 per cent over eleven years. Meeting this end use requires about 3.40 to 3.77 per cent annual growth in metal delivered to customers. It also requires replacement capacity for any existing production that declines.
For the extra robot factories, 95 per cent net factory yield means 1.72 million to 3.45 million tonnes of external annual feed. Half qualified secondary input leaves 862,000 tonnes to 1.72 million tonnes of new primary copper. These are procurement quantities; the preceding market total measures metal in end uses. World mines produced about 23 million tonnes of contained copper in 2025 and refineries produced 29 million tonnes including recycled feed. Refinery output, end use and mine output have different boundaries. USGS 2026 production estimates.
The half-secondary robot case needs reference ore throughput of 203 million to 406 million tonnes annually, using 0.5 per cent copper grade and 85 per cent combined recovery. Its primary metal equals 1.18 to 2.36 years of Australia's 730,000 tonne 2025 mine output, delivered within one year. Its ore mass is equivalent to 21 to 42 per cent of Australia's 961 million tonne iron ore output. The 12 October 2026 Australian production tables provide those benchmarks. Copper needs its own processing route.
With zero secondary input, the robot case needs 1.72 million to 3.45 million tonnes of primary copper and 406 million to 812 million tonnes of reference ore. At 25 per cent secondary input it needs 1.29 million to 2.59 million tonnes of primary metal and 304 million to 609 million tonnes of ore. Secondary supply needs collection, processing and an allocation to these customers.
Aluminium demand and processing capacity
McKinsey's 24 July 2025 aluminium outlook projects total annual demand rising from 106 million tonnes in 2025 to 130 million in 2035, including growing energy and transport uses. Its separate 2035 supply outlook is 78 million tonnes of primary metal plus 48 million tonnes of secondary metal: 126 million tonnes in total, leaving a four million tonne market gap. These quantities separate new smelting from recycling.
Extending each of those published series by its own compound rate for one further year gives a 2036 demand base of 132.7 million tonnes, primary supply of 78.5 million and secondary supply of 50.0 million. The remaining base-market gap is 4.18 million tonnes. This one-year extension is a 7 November assumption. Treating the modelled humanoid batch as additional adds 6.96 million to 10.2 million tonnes, taking total end use to 139.6 million to 142.9 million tonnes in 2036. That is 33.6 million to 36.9 million tonnes above 2025 use, or 32 to 35 per cent higher. The published outlook does not identify a humanoid allowance; any such volume must be deducted before adding the batch.
The robot factories require 7.33 million to 10.8 million tonnes of annual feed at 95 per cent net yield. With half secondary feed, they require 3.66 million to 5.39 million tonnes each of primary and secondary metal. Australia produced 1.57 million tonnes of primary aluminium in 2025. The robot primary addition alone equals 2.33 to 3.43 years of that output, or 6.2 to 9.1 operations at Tomago's stated 590,000 tonne annual scale. Australian 2025 output; Tomago scale checked 7 November 2026.
Adding robot primary feed to the extended supply pipeline requires 82.2 million to 83.9 million tonnes of annual primary output, alongside its new secondary feed. The wider market still needs the 4.18 million tonne gap filled. Filling it entirely through secondary supply requires 57.8 million to 59.6 million tonnes of secondary output and keeps primary output at the lower range. Filling it entirely through primary metal requires 86.4 million to 88.1 million tonnes of primary output and 53.7 million to 55.4 million tonnes of secondary output. Intermediate mixes sit between those cases.
Across those supply choices, primary output of 82.2 million to 88.1 million tonnes is 8.18 million to 14.1 million tonnes above the USGS 2025 output estimate of 74 million. That is roughly 14 to 24 additional Tomago-sized annual outputs globally. It also exceeds the USGS end-2025 installed smelter capacity of 79.7 million tonnes by 2.48 million to 8.38 million tonnes. The older market outlook used 73 million tonnes for 2025 primary supply; the comparison here retains the newer USGS 74 million tonne production benchmark. USGS 2026 aluminium estimates.
For robot feed alone, zero secondary input requires 7.33 million to 10.8 million tonnes of primary aluminium and 29.3 million to 43.1 million tonnes of reference bauxite. At 25 per cent secondary input it requires 5.50 million to 8.08 million tonnes of primary metal and 22.0 million to 32.3 million tonnes of bauxite. At 50 per cent it requires 3.66 million to 5.39 million tonnes of primary metal and 14.7 million to 21.6 million tonnes of bauxite. The last ore quantity equals 14 to 21 per cent of Australia's 102.5 million tonne 2025 output. The process assumption is four tonnes of dry bauxite per tonne of primary metal.
Match the infrastructure before adding totals
The market bases already include substantial power, transport and construction demand. The faster ground-computing and orbital cases later in this paper need a further allowance for infrastructure above those market assumptions. The calculation must replace the relevant sector allowance with the chosen project's inventory, then add its net increase. This avoids counting the same power line, data centre or panel twice. The figures above quantify growing markets plus the specified robot manufacture; complete inventories for the faster infrastructure cases remain a separate measured requirement.
Put the metal volumes in familiar dimensions
For the accelerated 2036 batch, the copper estimate is about 1.64 million to 3.28 million tonnes. At Geoscience Australia's copper density of 8.96 tonnes per cubic metre, this occupies about 183,000 to 366,000 cubic metres as solid metal. Picture a rectangular 50 metre swimming pool, 25 metres wide and two metres deep: 2,500 cubic metres. The copper would fill approximately 73 to 146 of those spaces. This calculation is dated 7 November 2026.
The aluminium estimate for that same year's robots is 6.96 million to 10.2 million tonnes. At Geoscience Australia's aluminium density of 2.7 tonnes per cubic metre, it occupies approximately 2.58 million to 3.79 million cubic metres as solid metal, enough for about 1,030 to 1,520 of the defined pool spaces. Finished robot bodies contain gaps and other materials, so their storage and transport volume needs dimensions from the selected design.
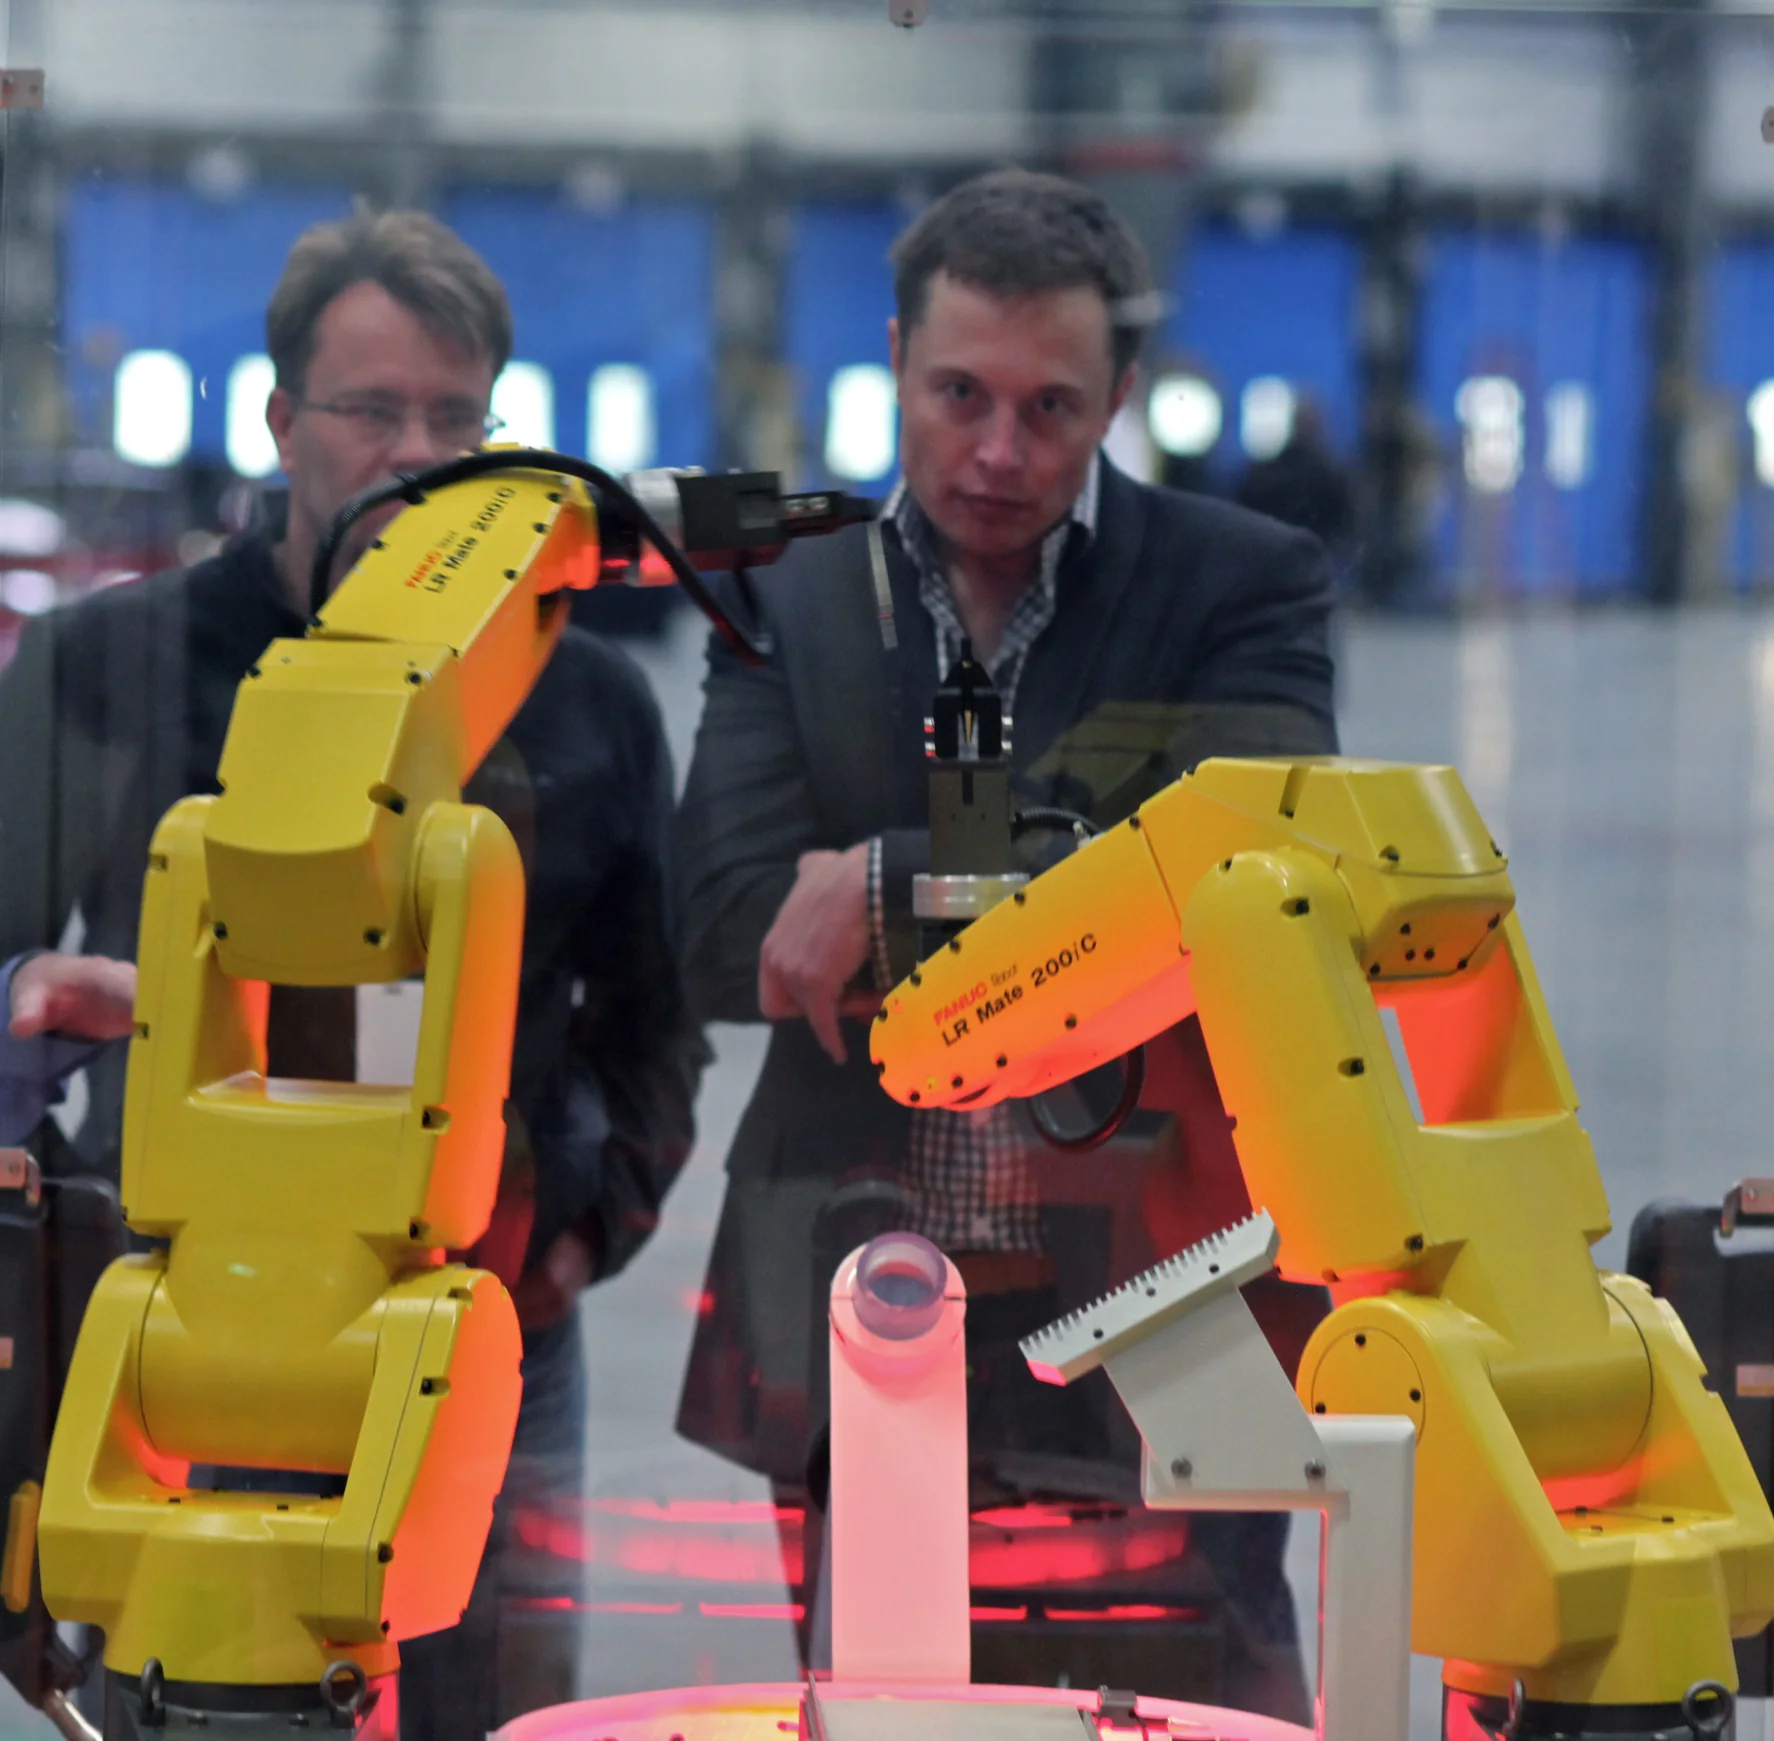

At roughly 410 million robots annually, reducing a material allowance by one kilogram per robot saves about 410,000 tonnes in that year's production. This 7 November calculation explains why modest improvements in each joint, frame or enclosure have industrial consequences at scale.
Equipment life with repair and safer automation
Human-operated cars provide an observed starting point for repairable equipment. Their survival records include accident losses, driving behaviour and decisions about whether to repair. Australia already supports long lives through mechanics, spare parts, wreckers, rebuilders and secondhand sales. The National Transport Commission's report using January 2025 registrations, checked on 6 November 2026, found that about half of Australian light vehicles remain in use for around 19 years. This is a survival estimate: the age at which about half have left service.
The US evidence shows improvement. Estimates for 2003 and 2020 reproduced in Greene and Leard's March 2023 research review put median passenger-car survival at 14.9 and 16.1 years. For SUVs and vans it increased from 16.6 to 18.2 years, and for pickups from 18.7 to 24 years. Manufacturing quality, maintenance, repair economics and owner decisions contribute to those outcomes.
The UK research reported on 24 January 2025 estimated median lives of 18.7 years for petrol cars, 16.8 for diesel cars and 18.4 for battery electric vehicles, using roadworthiness records from 2005 to 2022. These statistical estimates show how newer equipment can mature towards long service lives.
A robot's operating hours and loads will matter alongside age. A household robot used intermittently faces a different wear pattern from one working continuous factory shifts. Batteries, bearings, seals, motors, cameras and computers have different maintenance needs. A sound frame can support several generations of components, much as a well-maintained ute can keep working through changes of tyres, gearbox and engine.
Automation can improve that starting point. Precise motion, smoother acceleration, collision avoidance and early fault detection could reduce damage and preserve frames and components. In its 24 September 2026 update, Waymo reported 82 per cent fewer injury-causing crashes and 95 per cent fewer serious-injury crashes than local human benchmarks, across more than 270 million autonomous miles through June in five US service areas. Those results support testing substantial safety gains. Machine longevity needs the rate of permanent equipment loss, which is a different measurement from injuries.
The long-life case therefore separates permanent accident losses from fatigue or corrosion that cannot be repaired, and from owner decisions to retire equipment. A damaged panel, worn bearing or upgraded processor enters the service-parts account while the machine remains in use. Precise operation and predictive maintenance can reduce those repair needs as well. Continuous work increases exposure to wear, so service records need operating hours and loads alongside calendar age.
For a transparent 7 November accident sensitivity, start with 1,000 machines that would otherwise be permanently lost in destructive accidents. A 90 per cent reduction leaves 100 lost and retains 900. A near-zero-loss case of 99 per cent reduction leaves ten lost and retains 990. At 60 kilograms each, those cases preserve 54,000 and 59,400 kilograms of complete machines respectively, before any repairs. The percentages are scenario inputs. Waymo's injury figures are evidence for the direction of improvement, rather than a measured conversion to robot losses.
The fleet calculation applies final retirements to each year's surviving batch. With the accelerated manufacturing path, annual final-retirement sensitivities of 0.25, 0.5 and one per cent leave approximately 1.049 billion, 1.045 billion and 1.038 billion robots operating at the end of 2036. These are all-cause survival cases, calculated on 7 November using end-year batches. Lower destructive-accident rates improve survival within them. Much of this rapidly expanding fleet is young, so these ten-year results do not establish a full lifetime.
Twenty to thirty years of supported service is a useful design hypothesis for repairable machines. It requires durable retained structures, available parts and continued software support. The model carries useful equipment forward and adds actual service parts and final losses. Human-driven car survival supplies evidence of what a mature repair economy already achieves; automation provides a reason to test improvements beyond it.
Servicing keeps material productive
Industrial robotics already has repair and remanufacturing businesses. In its service report checked on 6 November 2026, FANUC describes about 80,000 repairs annually in Japan, including support for industrial products manufactured more than 40 years earlier. ABB's robot remanufacturing procedure checked on the same date includes a 152-point inspection, replacement of worn or failed parts, reassembly and at least 16 hours of load testing.
Computing has a similar reuse chain. Microsoft reported on 17 April 2025 that it reused 3.2 million components during 2024. Processors, memory and other assemblies can move into further service after their first installation. Robot manufacturers also provide accessible modules: the Unitree H1 specifications checked on 6 November 2026 describe a quickly replaceable battery, while Apptronik's 2023 Apollo announcement describes swappable batteries.
A wider robot service industry could include independent workshops, mobile technicians, joint rebuilding, battery refurbishment, sensor calibration, processor upgrades and certified used parts. Access to service information and compatible components would help it grow. Continuing software support and owner-controlled backups would preserve useful machines through changes of supplier.
People may also become attached to a familiar robot's voice, movement, memories and behaviour. This is a 7 November 2026 ownership hypothesis: that attachment could support spending on refurbishment and continuity of identity. It strengthens the commercial case for repairable designs, although service-life estimates still need observed operating histories.
For a concrete service calculation, assume a 60 kilogram robot receives an 18 kilogram overhaul kit: a 12 kilogram battery module, a two kilogram controller assembly and four kilograms of worn mechanical parts. It retains 42 kilograms of serviceable equipment. These component masses are engineering assumptions dated 7 November, to be replaced by a measured service specification.
One million such service jobs require 18 million kilograms of modules, or 18,000 tonnes, while retaining 42 million kilograms of existing equipment. If half the four kilogram mechanical allowance can be reconditioned, the newly supplied material becomes 16 million kilograms, or 16,000 tonnes, for those same million jobs. The required workshop capacity follows the number of service jobs actually scheduled.
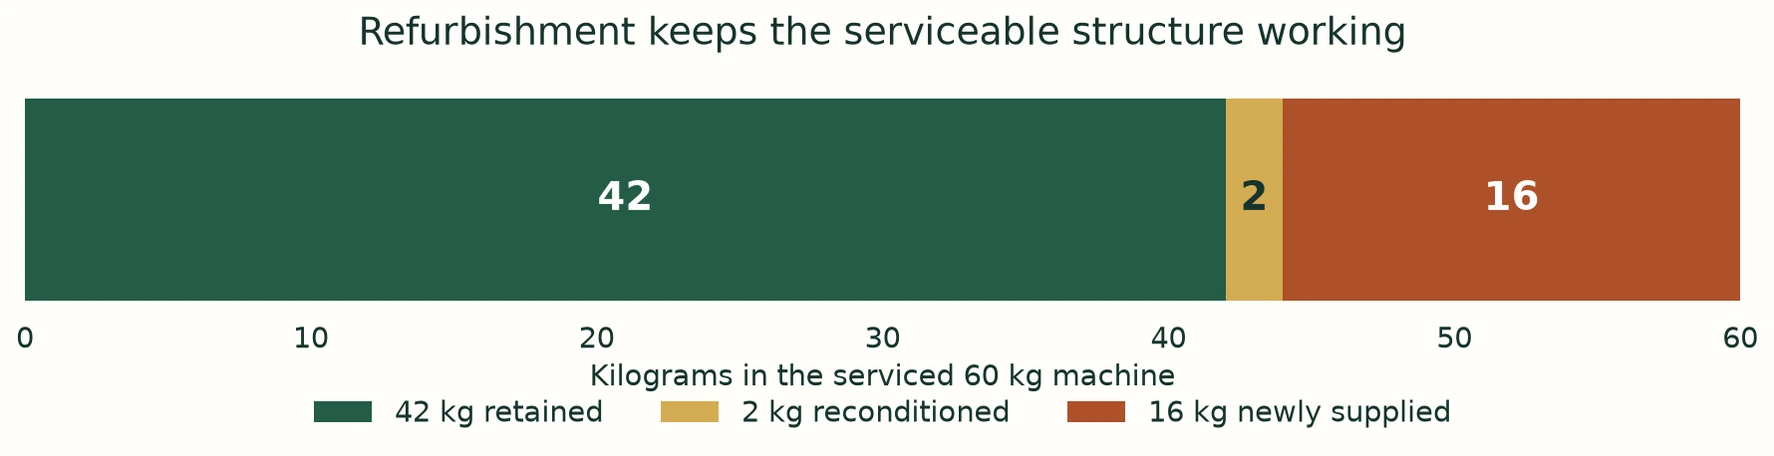
For an individual machine, an initial 60 kilograms plus three 18 kilogram overhauls means 114 kilograms of finished equipment and parts supplied over its service history. If that history spans twenty years, the frame and retained components support twenty years of use. The calculation sizes a repairable design; its actual durability must be demonstrated in operation.
Ground computing needs a range of power expansion cases
These electricity paths describe requirements to be supplied. A valid supply plan also meets clean-energy transition targets, essential services and wider development. New clean generation is first allocated to replacing fossil electricity, serving essential demand growth and replacing retired clean supply. The remaining delivered energy can support additional compute and robots. Any shortfall stays visible as additional generation and network capacity to build. These are planning requirements adopted on 7 November 2026.
The IEA's 16 April 2026 computing-energy outlook estimated 485 terawatt-hours of worldwide data-centre electricity in 2025 and projected 950 in 2030. That implies about 14.4 per cent compound annual growth between those dates. This paper tests three ground-computing paths from the 2025 starting point: continuing that 14.4 per cent rate through 2036, 20 per cent annual growth, and 30 per cent annual growth. All are 7 November 2026 scenarios.
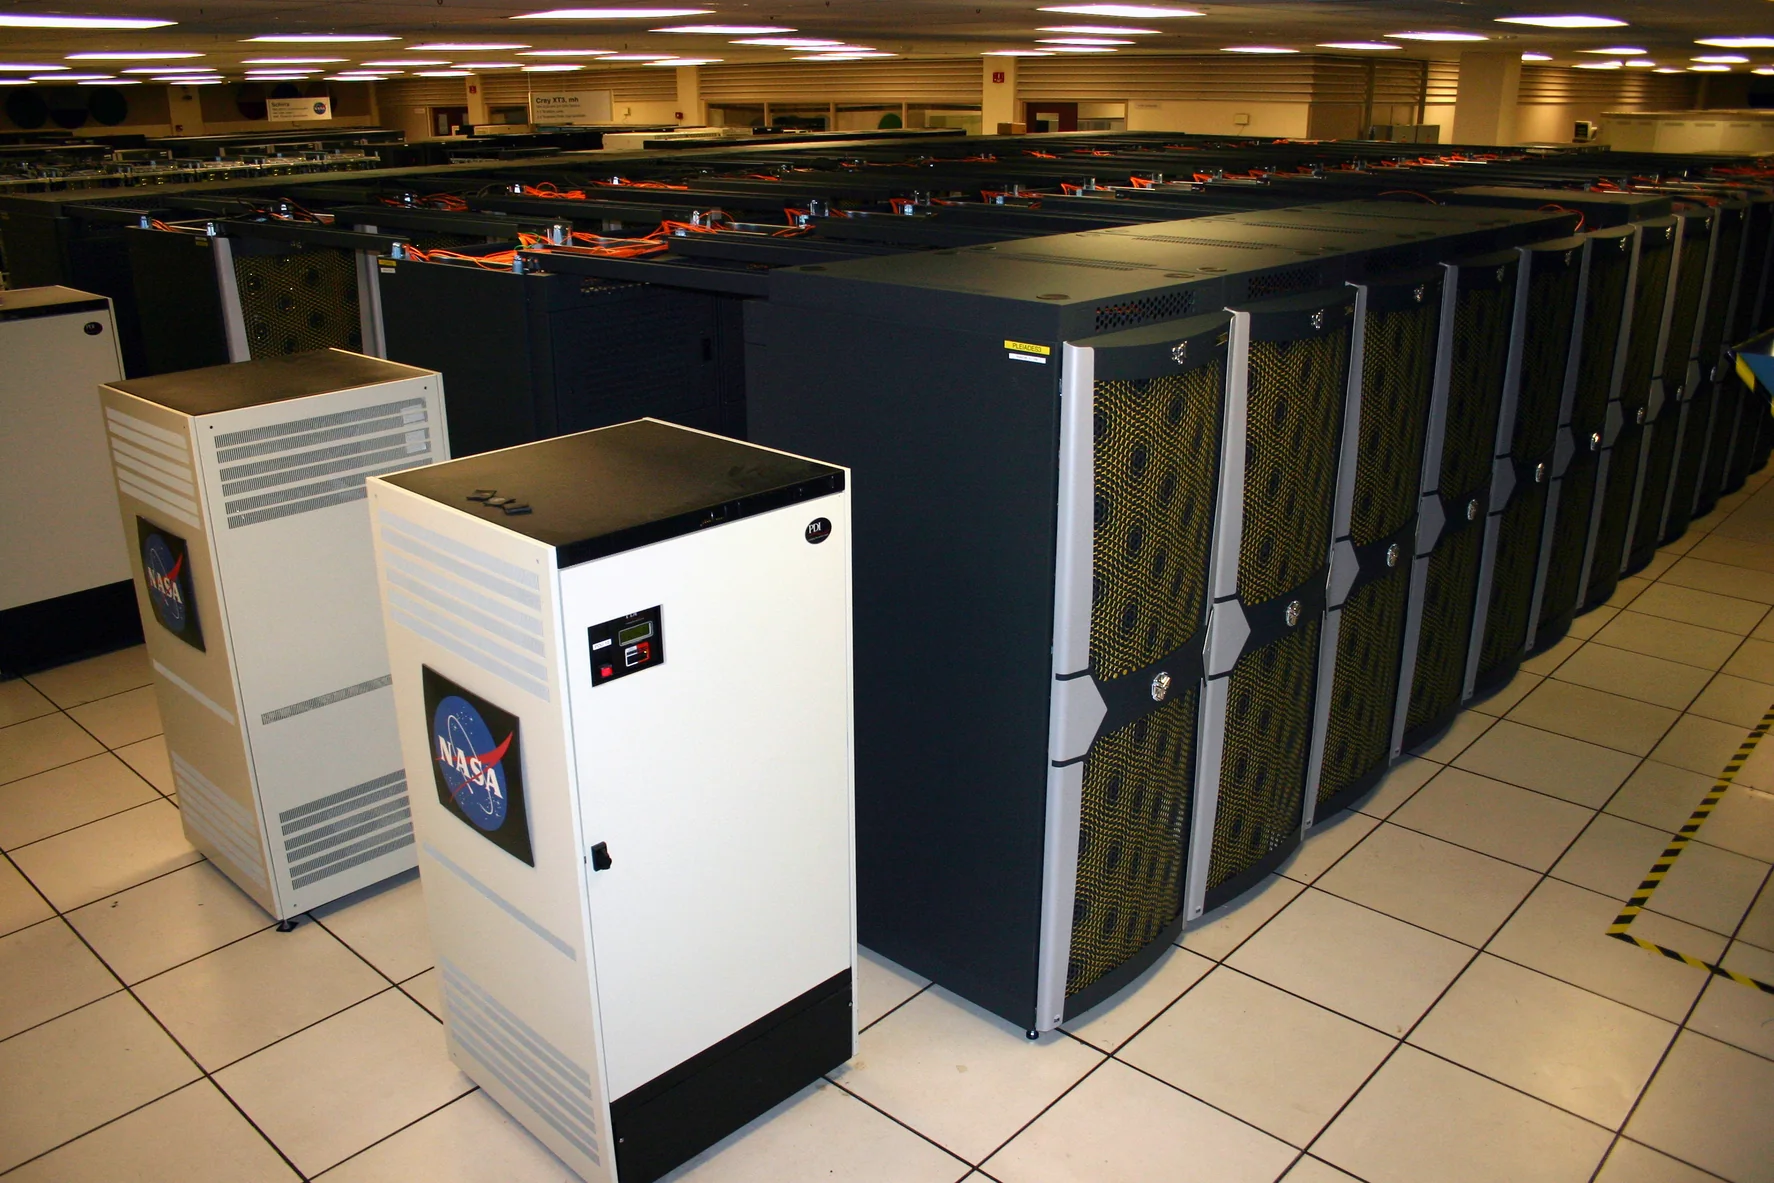

A terawatt-hour measures energy delivered over time. A gigawatt measures a rate of power use. To translate the energy scenarios into equipment ratings, the calculations assume computing equipment averages 80 per cent of rated consumption and facility overhead adds 20 per cent to its electricity use. Under those inputs, one gigawatt of rated computing consumes about 8.41 terawatt-hours annually, including overhead.
For an Australian comparison, the Australian Government's 2026 electricity statistics estimate total Australian generation during 2025 at 286.8 terawatt-hours. Every country-equivalent below uses that annual quantity. It includes Australia's full reported generation, rather than one state or one grid.
The HPE rack specifications checked on 5 November 2026 give a GB200 NVL72 configuration weighing approximately 1.47 tonnes. The NVIDIA GB200 hardware documentation checked that day gives a reference power rating of about 120 kilowatts. Using those reference specifications produces approximately 12,300 tonnes of complete racks per gigawatt of rated computing. A procured installation needs a matched mass and power specification.
2027
14.4 per cent annual electricity growth: 635 terawatt-hours in 2027, equal to 2.21 times Australia's 2025 generation. The rated computing base is 75.5 gigawatts, housing 926,000 tonnes of reference racks. That year's net increase is 9.49 gigawatts, requiring 116,000 tonnes of additional reference racks. Supplying its added annual energy solely from solar at 25 per cent capacity factor needs 36.5 gigawatts of new panels, compared with about 511 gigawatts added worldwide in 2025.
20 per cent annual electricity growth: 698 terawatt-hours in 2027, equal to 2.44 times Australia's 2025 generation. The rated computing base is 83 gigawatts, housing 1.02 million tonnes of reference racks. That year's net increase is 13.8 gigawatts, requiring 170,000 tonnes of additional reference racks. Supplying its added annual energy solely from solar at 25 per cent capacity factor needs 53.2 gigawatts of new panels, compared with about 511 gigawatts added worldwide in 2025.
30 per cent annual electricity growth: 820 terawatt-hours in 2027, equal to 2.86 times Australia's 2025 generation. The rated computing base is 97.5 gigawatts, housing 1.2 million tonnes of reference racks. That year's net increase is 22.5 gigawatts, requiring 276,000 tonnes of additional reference racks. Supplying its added annual energy solely from solar at 25 per cent capacity factor needs 86.4 gigawatts of new panels, compared with about 511 gigawatts added worldwide in 2025.
2028
14.4 per cent annual electricity growth: 726 terawatt-hours in 2028, equal to 2.53 times Australia's 2025 generation. The rated computing base is 86.3 gigawatts, housing 1.06 million tonnes of reference racks. That year's net increase is 10.9 gigawatts, requiring 133,000 tonnes of additional reference racks. Supplying its added annual energy solely from solar at 25 per cent capacity factor needs 41.7 gigawatts of new panels, compared with about 511 gigawatts added worldwide in 2025.
20 per cent annual electricity growth: 838 terawatt-hours in 2028, equal to 2.92 times Australia's 2025 generation. The rated computing base is 99.7 gigawatts, housing 1.22 million tonnes of reference racks. That year's net increase is 16.6 gigawatts, requiring 204,000 tonnes of additional reference racks. Supplying its added annual energy solely from solar at 25 per cent capacity factor needs 63.8 gigawatts of new panels, compared with about 511 gigawatts added worldwide in 2025.
30 per cent annual electricity growth: 1,066 terawatt-hours in 2028, equal to 3.72 times Australia's 2025 generation. The rated computing base is 127 gigawatts, housing 1.55 million tonnes of reference racks. That year's net increase is 29.2 gigawatts, requiring 359,000 tonnes of additional reference racks. Supplying its added annual energy solely from solar at 25 per cent capacity factor needs 112 gigawatts of new panels, compared with about 511 gigawatts added worldwide in 2025.
2029
14.4 per cent annual electricity growth: 830 terawatt-hours in 2029, equal to 2.9 times Australia's 2025 generation. The rated computing base is 98.8 gigawatts, housing 1.21 million tonnes of reference racks. That year's net increase is 12.4 gigawatts, requiring 152,000 tonnes of additional reference racks. Supplying its added annual energy solely from solar at 25 per cent capacity factor needs 47.7 gigawatts of new panels, compared with about 511 gigawatts added worldwide in 2025.
20 per cent annual electricity growth: 1,006 terawatt-hours in 2029, equal to 3.51 times Australia's 2025 generation. The rated computing base is 120 gigawatts, housing 1.47 million tonnes of reference racks. That year's net increase is 19.9 gigawatts, requiring 244,000 tonnes of additional reference racks. Supplying its added annual energy solely from solar at 25 per cent capacity factor needs 76.5 gigawatts of new panels, compared with about 511 gigawatts added worldwide in 2025.
30 per cent annual electricity growth: 1,385 terawatt-hours in 2029, equal to 4.83 times Australia's 2025 generation. The rated computing base is 165 gigawatts, housing 2.02 million tonnes of reference racks. That year's net increase is 38 gigawatts, requiring 466,000 tonnes of additional reference racks. Supplying its added annual energy solely from solar at 25 per cent capacity factor needs 146 gigawatts of new panels, compared with about 511 gigawatts added worldwide in 2025.
2031
14.4 per cent annual electricity growth: 1,087 terawatt-hours in 2031, equal to 3.79 times Australia's 2025 generation. The rated computing base is 129 gigawatts, housing 1.59 million tonnes of reference racks. That year's net increase is 16.3 gigawatts, requiring 199,000 tonnes of additional reference racks. Supplying its added annual energy solely from solar at 25 per cent capacity factor needs 62.4 gigawatts of new panels, compared with about 511 gigawatts added worldwide in 2025.
20 per cent annual electricity growth: 1,448 terawatt-hours in 2031, equal to 5.05 times Australia's 2025 generation. The rated computing base is 172 gigawatts, housing 2.11 million tonnes of reference racks. That year's net increase is 28.7 gigawatts, requiring 352,000 tonnes of additional reference racks. Supplying its added annual energy solely from solar at 25 per cent capacity factor needs 110 gigawatts of new panels, compared with about 511 gigawatts added worldwide in 2025.
30 per cent annual electricity growth: 2,341 terawatt-hours in 2031, equal to 8.16 times Australia's 2025 generation. The rated computing base is 278 gigawatts, housing 3.41 million tonnes of reference racks. That year's net increase is 64.2 gigawatts, requiring 788,000 tonnes of additional reference racks. Supplying its added annual energy solely from solar at 25 per cent capacity factor needs 247 gigawatts of new panels, compared with about 511 gigawatts added worldwide in 2025.
2036
14.4 per cent annual electricity growth: 2,129 terawatt-hours in 2036, equal to 7.42 times Australia's 2025 generation. The rated computing base is 253 gigawatts, housing 3.1 million tonnes of reference racks. That year's net increase is 31.8 gigawatts, requiring 391,000 tonnes of additional reference racks. Supplying its added annual energy solely from solar at 25 per cent capacity factor needs 122 gigawatts of new panels, compared with about 511 gigawatts added worldwide in 2025.
20 per cent annual electricity growth: 3,604 terawatt-hours in 2036, equal to 12.6 times Australia's 2025 generation. The rated computing base is 429 gigawatts, housing 5.26 million tonnes of reference racks. That year's net increase is 71.4 gigawatts, requiring 876,000 tonnes of additional reference racks. Supplying its added annual energy solely from solar at 25 per cent capacity factor needs 274 gigawatts of new panels, compared with about 511 gigawatts added worldwide in 2025.
30 per cent annual electricity growth: 8,692 terawatt-hours in 2036, equal to 30.3 times Australia's 2025 generation. The rated computing base is 1,034 gigawatts, housing 12.7 million tonnes of reference racks. That year's net increase is 239 gigawatts, requiring 2.93 million tonnes of additional reference racks. Supplying its added annual energy solely from solar at 25 per cent capacity factor needs 916 gigawatts of new panels, compared with about 511 gigawatts added worldwide in 2025.
The three rates test the implications of continued expansion and progressively faster delivery. The applications and construction programmes establish a credible reason to examine rapid growth. They do not by themselves allocate a precise share of future worldwide electricity to data centres. Operating projects, connection dates and accepted computing deliveries will improve that allocation over time.
For every 100 million robots in service drawing an assumed average 250 watts each at the electricity supply, annual consumption is about 219 terawatt-hours, or 76 per cent of Australia's 2025 generation. This 7 November operating example is additional to data-centre electricity. Actual task, working hours, idle power and charging losses determine the appropriate average.
Generation and storage also require materials
The power supply belongs in the industrial material account. Consider 100 gigawatts of rated computing equipment at 80 per cent average load and a facility power factor of 1.2. Average facility load is 96 gigawatts, consuming about 841 terawatt-hours annually, or 2.93 times Australia's 2025 generation. This is a 7 November design example.
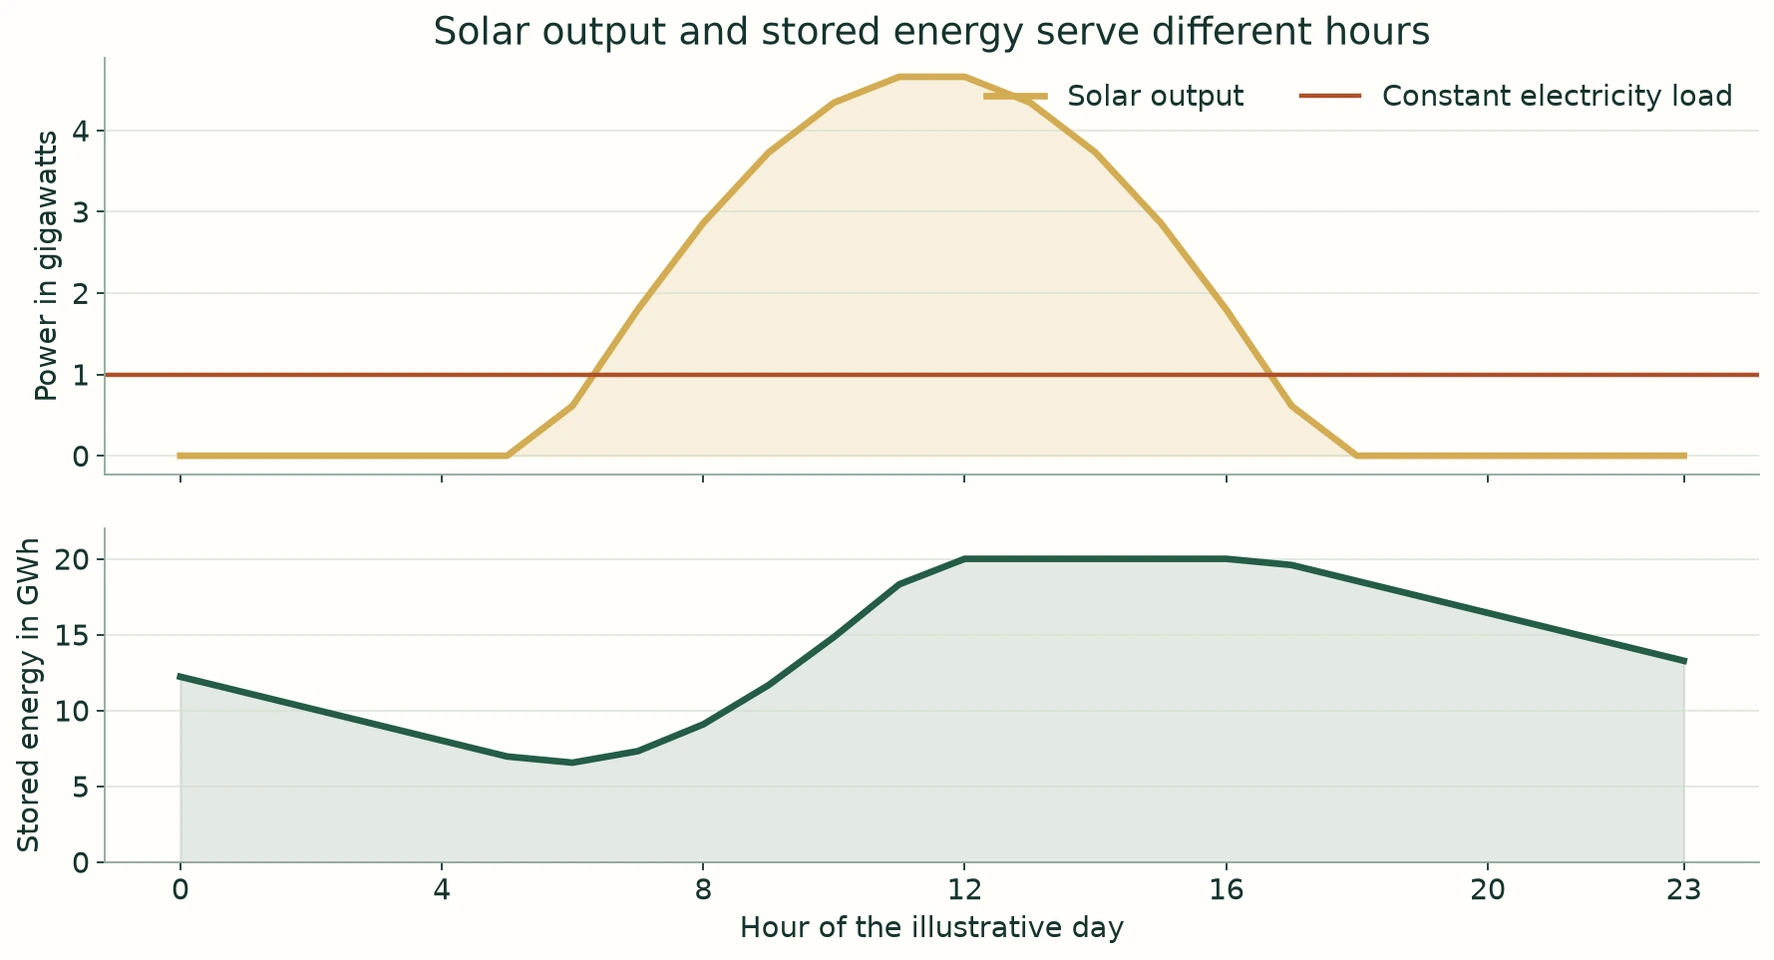
At a 25 per cent solar capacity factor, annual energy before storage losses requires 384 gigawatts of panels. If 65 per cent of delivered electricity passes through batteries with 95 per cent charging and 95 per cent discharging efficiency, the required panel rating rises to about 411 gigawatts. That is about 80 per cent of the world's 2025 solar additions. The formula is 96 gigawatts × [0.35 + 0.65 divided by 0.9025] divided by 0.25. All operating shares and efficiencies are explicit 7 November assumptions.
With 23 per cent cell efficiency and 120 micrometres of active silicon, that 411 gigawatt installation contains approximately 500,000 tonnes of active silicon. At ten milligrams of silver per nameplate watt it needs about 4,110 tonnes of silver. These describe a selected panel recipe. Thinner wafers, alternative absorber materials and lower-silver or copper contacts change the inventory. Glass, frames, inverters, supports and networks must be added from the actual project design.
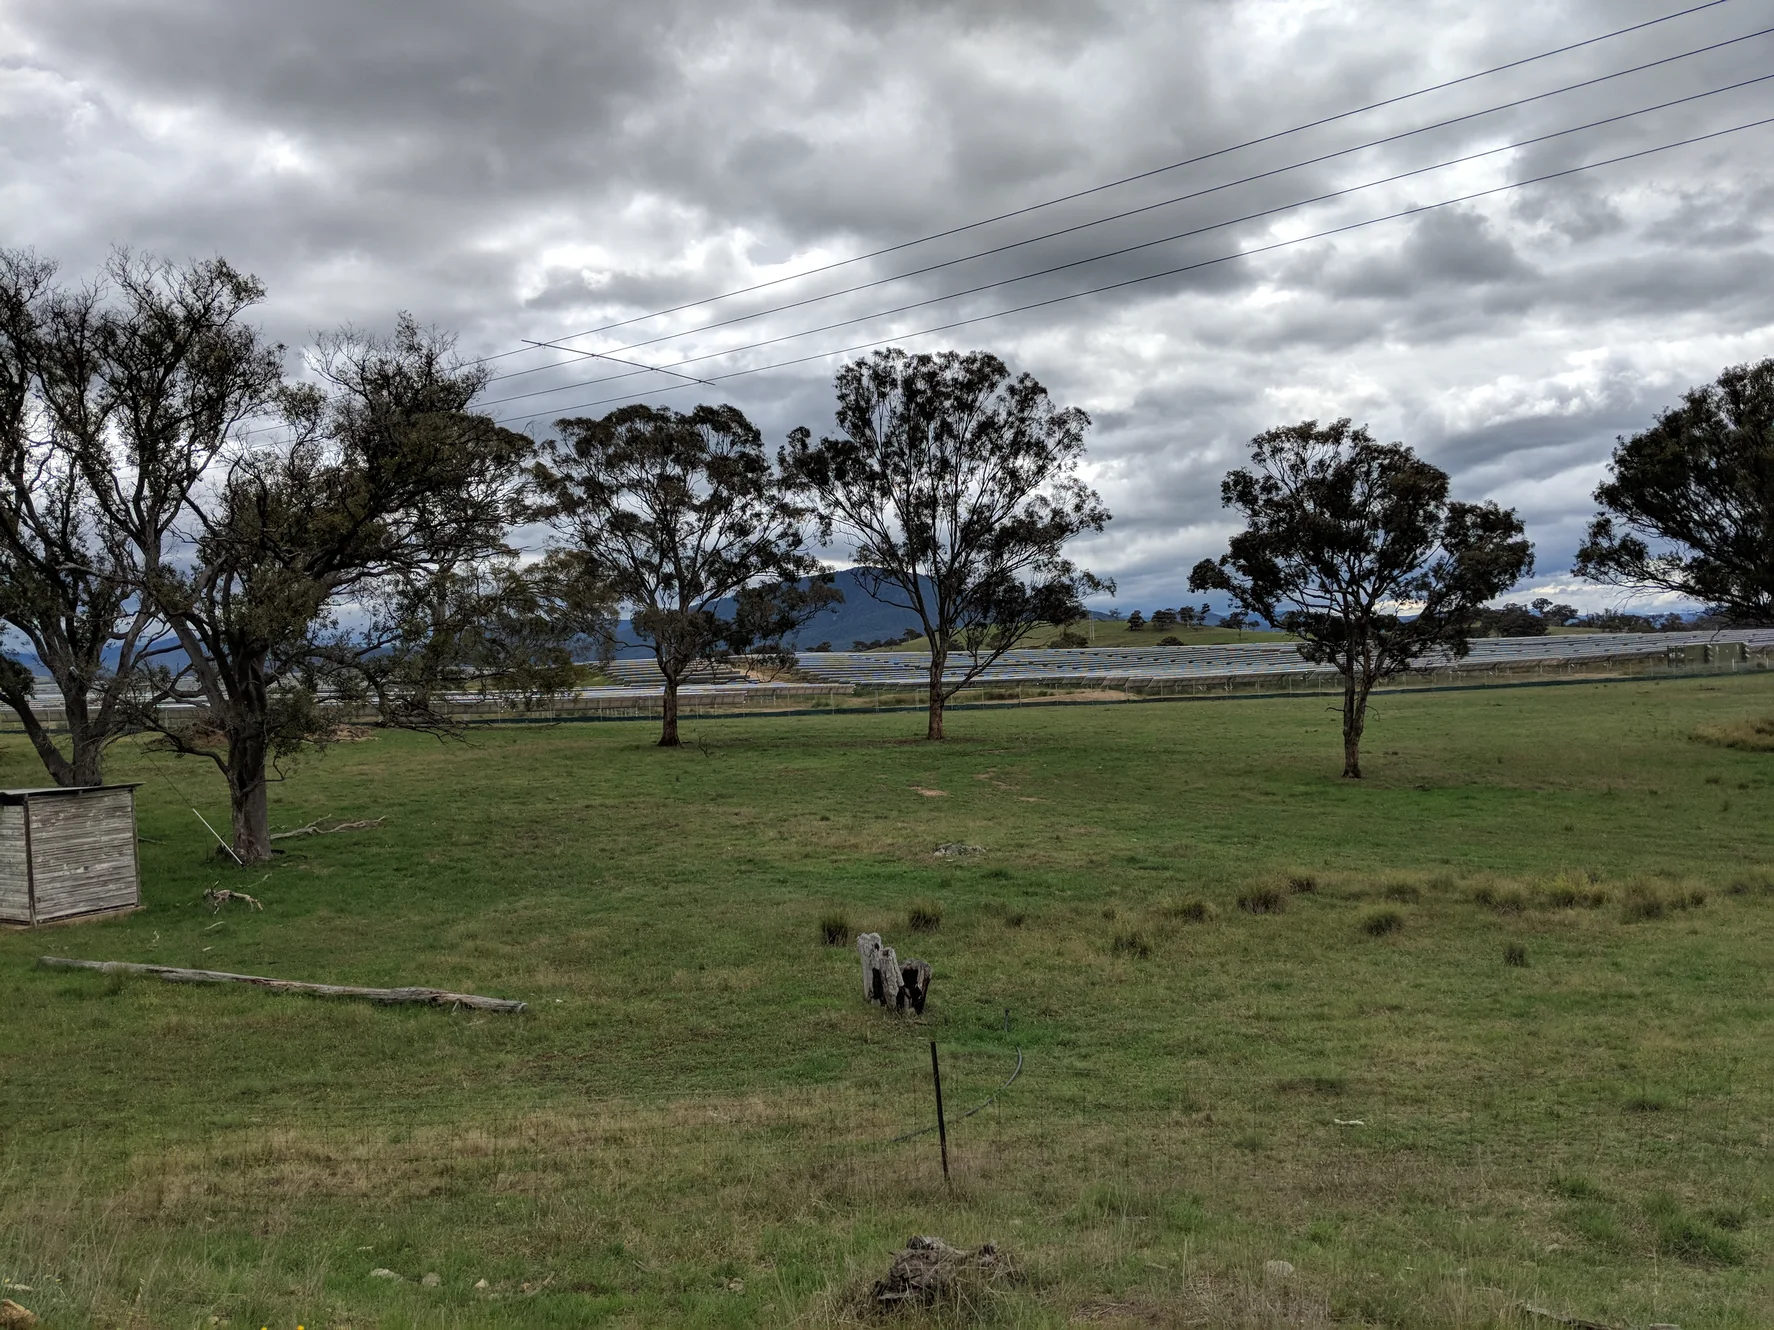

A four-hour buffer at the full 120 gigawatt facility load must deliver 480 gigawatt-hours. With 90 per cent usable state of charge and 95 per cent discharge efficiency, nominal stored energy must be about 561 gigawatt-hours: 480 divided by 0.90 and 0.95. Using the lithium iron phosphate cathode recipe specified later, that requires about 51,400 tonnes of cathode lithium. It equals 16 per cent of world 2025 lithium mine output and 44 per cent of Australian output on Geoscience Australia's updated basis.
A sixteen-hour buffer at the same full facility load must deliver 1,920 gigawatt-hours and needs about 2,250 gigawatt-hours nominal. The selected cathode contains approximately 206,000 tonnes of lithium, equal to 66 per cent of world 2025 mine output or 1.75 years of Australian output. These battery quantities are manufactured stocks for the installation. Complete packs add anodes, electrolyte, current collectors, enclosures and controls. Different chemistries change the elemental requirement.
Annual energy and buffer duration are separate tests. Seasonal weather, low-output spells, charging power, networks and outages determine dependable supply. Nuclear, wind, hydro, solar, storage and shared networks provide different combinations. Fusion adds a further firm-power route if projects demonstrate reliable net electricity and repeatable construction. Every pathway needs a material inventory and commissioning schedule. Power allocated to clean-energy transition and essential development remains protected while this new load is supplied.
Applications reveal what is coming before construction
The Australian Energy Market Operator's 21 October 2026 connections update reports 80.9 gigawatts of generation and storage projects in the National Electricity Market connection process, exceeding the existing 77 gigawatts of generation and storage on the same stated basis. The pipeline grew 43 per cent over the preceding year. During the September quarter, new applications totalled 7.5 gigawatts, application approvals totalled 4.5 gigawatts, and 1.3 gigawatts completed commissioning and reached full output. These are successive project stages.
AEMO reports batteries as 55 per cent of pipeline capacity and combined solar-and-battery projects as another 19 per cent. Storage makes generation available at a different time and supports system operation. Its power rating alone does not reveal new annual electricity production; the energy duration and charging source also enter the calculation. AEMO's national-market pipeline excludes some other Australian systems, including Western Australia's separate main grid.
For the United States, Berkeley Lab's June 2026 queue study records about 8,200 active projects at the end of 2025, comprising 1,312 gigawatts of generation and 749 gigawatts of storage. Of the combined pipeline, 549 gigawatts had a draft or executed interconnection agreement. Historical withdrawals were high: only 13 per cent of capacity entering the 2000 to 2020 queues had reached operation by the end of 2025. Queue reforms can change that outcome; it would be inappropriate to apply either universal completion or a fixed historical rejection rate to new projects.
Britain's December 2025 connections reform announcement prioritised a pipeline of 283 gigawatts of generation and storage and 99 gigawatts of transmission-connected demand. The demand side includes prospective users of electricity, while the generation side supplies it. Recording both helps identify the location and timing of future industrial development.
Nuclear applications give more specific project evidence. The US Nuclear Regulatory Commission's 2026 licensing record, checked on 7 November, records the construction permit for TerraPower's Kemmerer project issued in March. Commonwealth Fusion Systems' 28 April 2026 announcement records its application to connect the proposed 400 megawatt ARC fusion plant to PJM, a US regional grid operator, targeting the early 2030s. Amazon's October 2026 Indiana announcement, checked on 7 November, describes a proposed 960 megawatt nuclear development within its wider programme targeting more than five gigawatts by 2039.
These records support a project-based account: identify the site, technology, rated output, application date, approval stage, construction progress and expected operating date. Generation projects, their connection requests and their power-purchase agreements refer to the same underlying electricity and are counted once. Financing and factory replication can bring more projects forward; actual commissioning updates the supply available to users.
The international push to increase electricity supply
The evidence checked on 7 November shows a broad international mobilisation around electricity, energy security and industrial demand. The United States' 20 April 2026 energy-infrastructure determination invokes the national energy emergency and directs support towards expanding production and infrastructure. The European Commission's AccelerateEU programme of 22 April and electrification plan of 17 July 2026 seek faster investment in domestic energy and electrification.
China's 23 July 2026 renewable-energy plan targets about 3,500 gigawatts of renewable generating capacity and approximately 6,000 terawatt-hours of renewable electricity annually by 2030. India's 9 August 2026 statement reports more than 300 gigawatts of non-fossil capacity at 31 July, towards its 500 gigawatt target for 2030. The African Mission 300 update of 16 June 2026 reports activity across 40 countries and a goal of connecting 300 million people by 2030. Australia's Capacity Investment Scheme, updated on 24 June 2026, targets 40 gigawatts of generation and storage capacity by 2030.
Installed additions are already large. IRENA's March 2026 statistics report approximately 692 gigawatts of renewable capacity added worldwide during 2025, including about 511 gigawatts of solar. The IEA's Global Energy Review 2026 reports 78 gigawatts of nuclear capacity under construction in 15 countries. These establish a substantial industrial base for further expansion.
The pace can vary between years. The IEA's Renewables 2026 outlook, checked on 7 November, forecasts a decline in annual renewable additions during 2026 from the high 2025 level, while projecting average additions of almost 800 gigawatts annually over 2026 to 2031. Sustained urgency can coexist with changing project schedules and policy settings. The capacity calculation must follow what reaches operation and the speed at which construction can subsequently expand.
The demand comes from several activities at once. Computing, electric transport, air conditioning and electrified industry all need additional electricity. Mines, refineries and factories also need power to build the expansion itself. The IEA's February 2026 electricity outlook forecasts total global electricity demand growth of 3.6 per cent annually through 2030 and calls for annual grid investment to rise by around 50 per cent. Computing is a smaller, rapidly growing part of that total and can expand much faster than the world average.
Space computing carries its power supply
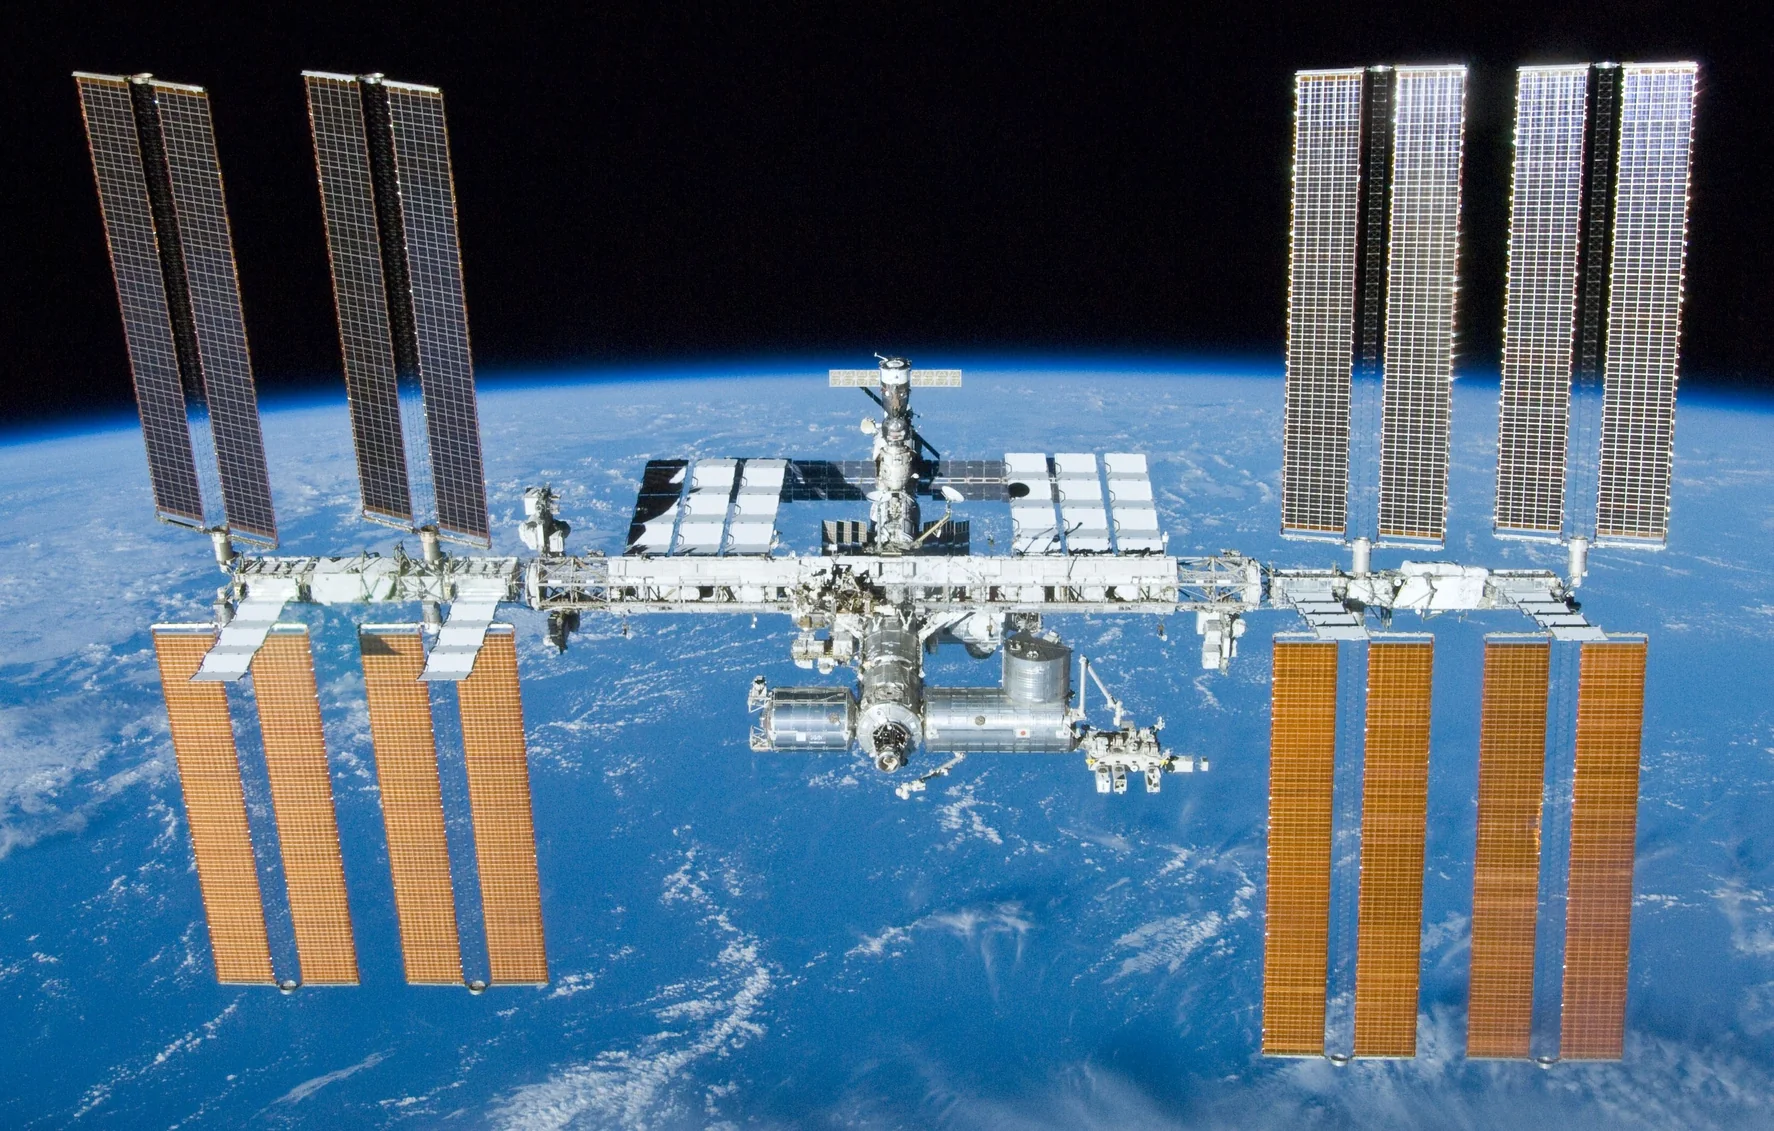
The SpaceX prospectus of 11 June 2026 sets out a large orbital-computing ambition. Power availability on Earth is one reason to examine computing systems whose solar generation is built into the spacecraft. Equipment in a suitable orbit can use extensive sunlight and exchange data with Earth while generating its operating electricity in space.
The Terafab programme checked on 7 November 2026 targets 1,000 gigawatts of annual chip output and ten million tons of annual orbital transport, retaining its unit wording. The orbital path below models partial realisation at 300 gigawatts commissioned annually once the ramp is complete. Its three million tonne annual payload is roughly one-third of the public transport ambition. This is a 7 November engineering scenario. Annual commissioning is estimated from the mean of the year's starting and ending production rates. A complete-system mass allowance of 10,000 tonnes per gigawatt covers computing, generation, thermal control and structures. This allowance requires validation against an engineered spacecraft design.

During 2027, commissioning 0.5 gigawatts requires 5,000 tonnes of complete orbital equipment at the chosen system allowance. By the end of that year, accumulated commissioning since 2027 is 0.5 gigawatts, representing 5,000 tonnes of equipment manufactured before actual retirements.
During 2028, commissioning 5.5 gigawatts requires 55,000 tonnes of complete orbital equipment at the chosen system allowance. By the end of that year, accumulated commissioning since 2027 is 6 gigawatts, representing 60,000 tonnes of equipment manufactured before actual retirements.
During 2029, commissioning 55 gigawatts requires 550,000 tonnes of complete orbital equipment at the chosen system allowance. By the end of that year, accumulated commissioning since 2027 is 61 gigawatts, representing 610,000 tonnes of equipment manufactured before actual retirements.
During 2031, commissioning 250 gigawatts requires 2.5 million tonnes of complete orbital equipment at the chosen system allowance. By the end of that year, accumulated commissioning since 2027 is 461 gigawatts, representing 4.61 million tonnes of equipment manufactured before actual retirements.
During 2036, commissioning 300 gigawatts requires 3 million tonnes of complete orbital equipment at the chosen system allowance. By the end of that year, accumulated commissioning since 2027 is 1,961 gigawatts, representing 19.6 million tonnes of equipment manufactured before actual retirements.
The full path manufactures about 19.6 million tonnes of orbital equipment over 2027 to 2036 and commissions a total of 1,961 gigawatts before actual losses or retirements. The calculation accumulates completed hardware and applies no calendar-based disposal rule. At 100 tonnes delivered per successful payload flight, the three million tonnes manufactured for 2036 requires 30,000 payload flights that year. At a full 1,000 gigawatts commissioned annually, the same allowance requires ten million tonnes of new orbital equipment each year. Transporting that mass requires 100,000 successful payload flights at 100 tonnes delivered per flight, or 50,000 at a qualified 200 tonnes per flight. These 7 November scale calculations show the additional manufacturing and transport associated with the larger programme.
An illustrative one gigawatt orbital design needs about 4.25 square kilometres of active solar cells at 23 per cent efficiency, a 0.90 output factor and a 20 per cent power allowance, using the solar irradiance reference checked on 5 November 2026. That active area is a square about 2.06 kilometres on each side. The design assumes continuous illumination; the selected orbit determines eclipse periods, storage and redundancy.
At 90 micrometres of active silicon, those cells contain about 892 tonnes of silicon. Packaging, wiring and supports add mass. A radiator rejecting one gigawatt at about 47 degrees Celsius needs approximately 2.10 square kilometres of emitting surface at emissivity 0.8 under idealised deep-space conditions, a square about 1.45 kilometres on each side. These 7 November calculations help test whether the complete spacecraft mass budget can support its generation and cooling.
Cell chemistry matters. The AZUR SPACE product information checked on 5 November 2026 includes compound-semiconductor technologies used in space. A germanium substrate produces a different mineral requirement from a thin silicon design. Computing performance, solar efficiency, radiator temperature, repair access and launch capacity can all change the mass per useful gigawatt.
Power beaming adds connections between generators and users
Small-scale wireless power transmission has been demonstrated. Japan Space Systems' report of 13 December 2024 describes aircraft-to-ground transmission over more than five kilometres, with beam control at 5.8 gigahertz. This demonstrates part of the control and transmission chain needed for a future space solar system.
Australia's Aquila project record checked on 7 November 2026 reports laboratory tests transferring 200 watts of optical power to a moving receiver and 300 watts to a stationary receiver. Its Earth-to-orbit Bifrost work is listed as a planned development. These are company-reported optical power tests; delivered electrical output needs its own conversion measurement.
Caltech's 1 June 2023 report on its MAPLE experiment describes wireless power transfer in orbit and detection on Earth of a beam directed from the spacecraft. Together, these demonstrations establish working transmission and control hardware at early scales. Larger applications need measured power delivered, efficiency, pointing performance and operating availability.
The possible uses include supplying other satellites, extending spacecraft service, powering moving machines and delivering orbital solar electricity to receivers on Earth. Those uses connect directly to the repair economy: an external energy supply could preserve a spacecraft or robot whose original power system limits its useful service.
For a direct 7 November sizing example, delivering one gigawatt of electricity through a beam requires two gigawatts from the source at 50 per cent end-to-end electrical efficiency. At 80 per cent efficiency it needs 1.25 gigawatts; at 25 per cent it needs four. These are engineering sensitivities, not measured efficiencies for the demonstrations above. They show how the selected link changes generator, transmitter, receiver and heat-rejection requirements.
An orbital computer using electricity locally and a satellite delivering electricity to Earth need different hardware inventories. Each generator's output can be allocated among its users, with losses counted along the chosen route. That prevents the same solar electricity being assigned simultaneously to a full computing load and a full export load.
Australian rare earth refining and alternative motors
An existing operating benchmark is the Australian-headquartered Lynas supply chain, with facilities in Australia and Malaysia. Its 26 August 2026 annual report records 7,260 tonnes of ready-for-sale NdPr oxide in the year ended 30 June 2026, approximately 6,220 tonnes of contained metal at the reference conversion. The accelerated 2036 robot batch needs 246,000 to 369,000 tonnes of NdPr metal with the reference motors, about 40 to 59 times that observed annual output. Avoiding 90 per cent through other motor designs lowers the requirement to 24,600 to 36,900 tonnes, about four to six times that Lynas benchmark. These comparisons hold the new requirement and operating output on a contained-metal basis.
Iluka's 2 November 2026 Eneabba update reports construction 65 per cent complete at 30 September, first production targeted for 2027 and a two-year ramp. It describes capacity for 55,000 tonnes of concentrate feed and up to 23,000 tonnes of separated rare earth oxides annually. NdPr oxide nameplate capacity is 5,500 tonnes, while its illustrated Eneabba and Balranald feed blend yields about 3,700 to 3,900 tonnes. Actual feed composition determines output.
The Northern Territory Government's 21 May 2026 Nolans announcement and project register checked on 5 November 2026 describe a target of late-2029 operation and approximately 4,440 tonnes of NdPr oxide annually. Combined with Iluka's illustrated blend, these designs represent about 8,140 to 8,340 tonnes of NdPr oxide, or approximately 6,980 to 7,150 tonnes of contained metal using the reference conversion. This is a 7 November design-output comparison before downstream losses and customer commitments.
At 0.6 to 0.9 kilograms of NdPr per robot, that contained metal equals the magnet material in approximately 7.8 million to 11.9 million robots. It gives a direct scale for the two projects while preserving their different commissioning and ramp dates. Other motor and energy customers also need their output.
The IEA's 2026 rare earth supply-chain report, checked on 5 November, estimates China's 2024 shares at approximately 60 per cent of magnet rare earth mining, 91 per cent of refining and 94 per cent of sintered magnet production. Australian processing, alloy manufacture and motor production can therefore add useful sovereignty beyond the mine itself.
Iron nitride offers another material route. The ideal compound with sixteen iron atoms and two nitrogen atoms is about 97 per cent iron and three per cent nitrogen by mass. Niron's 10 September 2026 Sartell announcement targets a factory producing up to 1,500 tons of magnets annually, using the company's unit wording, with operation targeted for 2027. The Moog and Niron announcement of 2 October 2026 describes motor development and intended commercialisation.
The following 7 November sensitivities apply alternative motors to the accelerated 2036 robot batch. All quantities are annual NdPr metal embodied in new robots.
Reference motors: 246,000 to 369,000 tonnes of NdPr metal.
25 per cent avoided: 184,000 to 276,000 tonnes of NdPr metal.
50 per cent avoided: 123,000 to 184,000 tonnes of NdPr metal.
90 per cent avoided: 24,600 to 36,900 tonnes of NdPr metal.
The 90 per cent substitution example also needs about 1.47 million to 2.21 million tonnes of iron nitride magnets if they weigh twice as much as the displaced magnets. That mass ratio is a 7 November design assumption requiring complete-motor testing. The iron content would be around 0.09 to 0.13 per cent of the world's 2025 contained-iron mine output. At this scale, magnet fabrication and qualified motor production would require much more expansion than bulk iron supply.
Existing magnets can also stay in service through bearing and other mechanical repairs. Retaining a useful magnet reduces new magnet demand and postpones its entry into recycling. Australian rare earth refining, longer component life and alternative magnet manufacturing can all contribute to the same expansion.
From manufactured material to source minerals
A mine supplies ore or concentrate. Refineries produce useful chemicals or metals. Component factories turn that material into parts. The calculation starts with the finished material, allows for net manufacturing losses, subtracts qualified recycled supply and then works backwards through the selected mineral process.
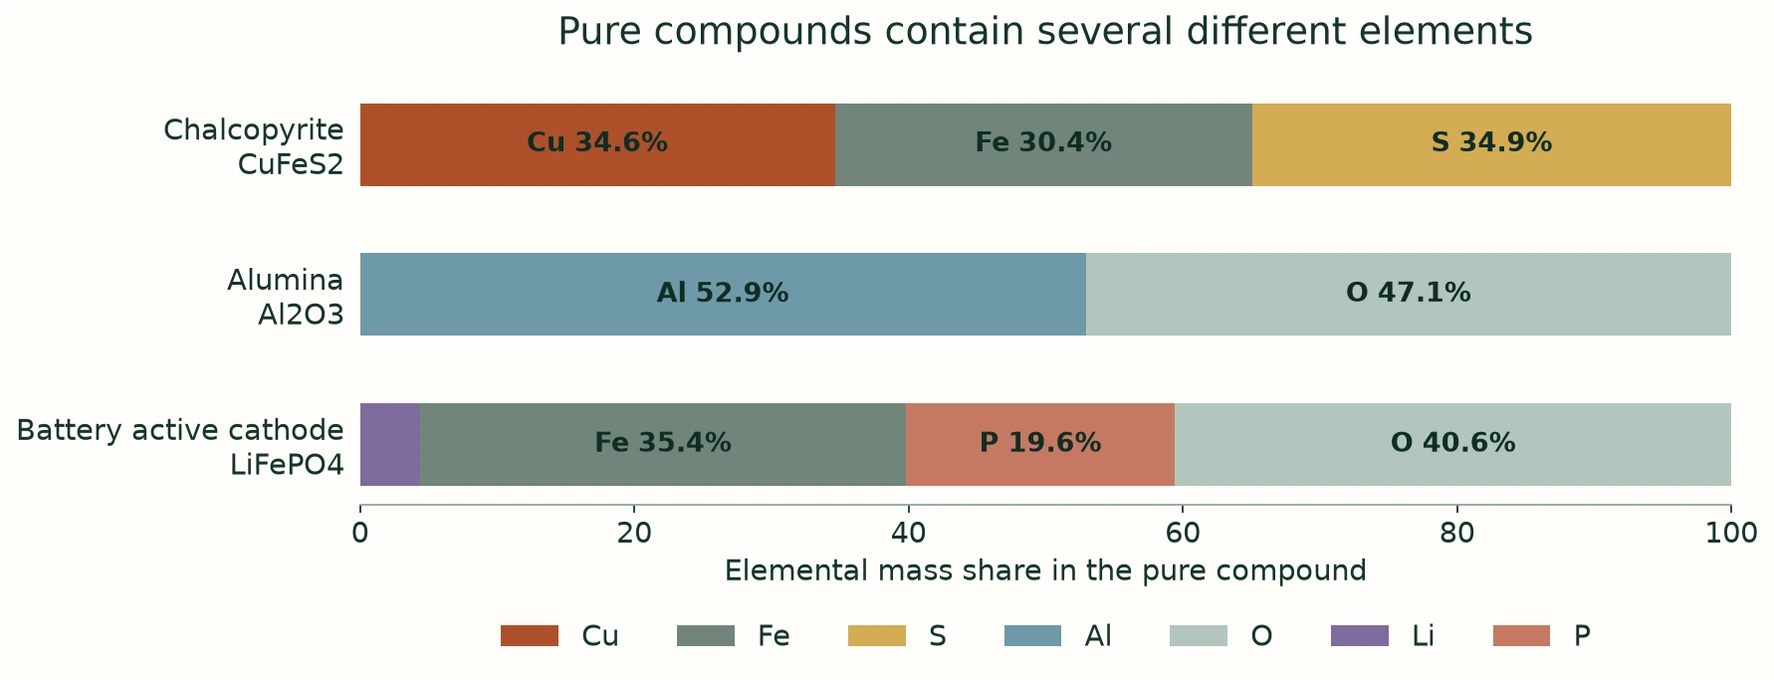
Atomic composition fixes the chemical conversions. Using the 2024 atomic-weight table checked on 5 November 2026, pure hematite contains about 69.9 per cent iron and magnetite about 72.4 per cent. Pure chalcopyrite contains approximately 34.6 per cent copper. An actual ore deposit mixes these minerals with other rock, so its measured grade determines how much must be processed.
For a copper ore grading 0.5 per cent copper, 200 tonnes of ore contain one tonne of copper before losses. At 85 per cent combined recovery to the required metal, approximately 235 tonnes of ore deliver one tonne. These grade and recovery assumptions are a 7 November reference process. A specific mine's assays and recovery results provide the project calculation.
Aluminium oxide contains about 52.9 per cent aluminium. Bauxite is a mixed ore whose grade and processing performance determine how much is required. The capacity calculation uses four tonnes of dry bauxite per tonne of primary aluminium as a stated engineering assumption.
Lithium carbonate contains about 18.8 per cent lithium, so one tonne of lithium corresponds to approximately 5.32 tonnes of lithium carbonate. A project reporting lithium carbonate equivalent must be converted before comparison with an elemental-lithium requirement. For a hard-rock ore grading one per cent lithium oxide, with 75 per cent overall recovery, approximately 287 tonnes of ore deliver one tonne of lithium under the 7 November reference process.
Monazite is a family of rare earth phosphate minerals. The mix of neodymium, praseodymium and other elements varies by deposit. Mineral-sands stockpiles can provide feed for refining; the relevant quantities are their actual mineral content and separation performance. A refinery's output is usefully specified by individual oxide or metal, rather than only a total rare earth basket.
For a rare earth ore grading five per cent total oxides, assume NdPr oxides form 20 per cent of those oxides, their contained-metal factor is 85.7 per cent, and overall recovery is 75 per cent. One tonne of that ore then delivers about 6.43 kilograms of NdPr metal; one tonne of NdPr needs about 156 tonnes of ore. These 7 November assumptions describe an example route to be replaced with the selected deposit and refinery data.
For the battery example above, lithium iron phosphate active cathode delivering 150 ampere-hours per kilogram at 3.2 volts needs about 2.08 kilograms per kilowatt-hour. Its lithium content is approximately 0.092 kilograms per kilowatt-hour, with 0.737 kilograms of iron and 0.409 of phosphorus. These 7 November design values cover the active cathode. A complete battery inventory adds the other materials and uses the chemistry actually selected.
Improvements can compound alongside production
Manufacturing and materials efficiency can improve together. If annual output doubles while material per unit falls by 20 per cent, total material demand rises by 60 per cent. If material per unit halves, doubled output uses the same total material. These 7 November relationships make the effect of better designs measurable.
The mine can also improve. Raising recovery from 85 to 95 per cent reduces ore required for a fixed output by about 11 per cent. Better sorting can improve the grade entering the processing plant, while new extraction routes can make additional feed useful. Actual material handling and process performance determine the gain.
Google DeepMind's GNoME announcement of 29 November 2023 describes a large expansion in predicted stable crystal structures. The autonomous synthesis research published that day demonstrates progress towards preparing selected materials. A useful industrial advance then needs repeatable performance, manufacturing yield and a route to volume production.
There are operating-industry examples of computational improvement. BHP and Microsoft's 30 May 2023 announcement describes AI-assisted copper recovery at Escondida. Rio Tinto's 15 January 2026 Nuton announcement links copper-processing development with Amazon Web Services. Future SI could accelerate these feedbacks through better design, control and experimentation.
Atomically precise manufacturing could further change structure, waste and component performance. Its contribution can enter the model as demonstrated material savings, higher accepted output or longer service. The growth scenarios remain open to those improvements and to faster factory replication. Measured results determine how strongly the feedback compounds.
Australian opportunities to meet domestic and export needs
Australia can build the machines that maintain its homes, farms, water systems, power networks and public spaces. A domestic manufacturing programme would give communities equipment they can own, repair and keep operating, while supplying export customers with the same practical independence. Starting production, training and supplier qualification now gives Australia more authority over the terms of the robot economy as United States and Chinese production expands.
The physical missing middle proposed in A Fair Go in the Age of Superintelligence comprises locally governed computing racks, power, workshops and civic robots. Australian manufacturing supplies that network. Individual Auras are software that their owners can run using this capability. The Web3 sensorium is the proposed intermediary layer. Purple Party for Australia, or P4A, is the proposed civic layer. Each has a different job. The public Australian installation proposal; GAJRA Earth and the global missing middle.


Build useful cities now and deeper resilience by 2045
Hayes's design brief, clarified on 7 November 2026, is a 20-million-person closed-loop city beneath Quandamooka Country, an Australian scenario of more than 100 million people by 2045, and a distributed network of subterranean cities across the Earth. The ambition is world-leading quality, rapid learning and industrial scale. The earlier 1.687-million-a-year Australian robot case is a modest worked ramp. Its quarter-reference throughput and factory schedule are modelling choices, not national limits.
The early activation case is useful housing, transport, clean power, water, local manufacturing and independent repair. Each stage creates assets people can use immediately. A confirmed celestial threat could change construction priorities, funding and isolation requirements. The programme can begin earlier on the strength of its everyday benefits. The Grain by Grain documentary mission, checked 7 November 2026, connects a useful Dunwich gateway to transport corridors, material processing, industry and the eventual generation city. A generation city carries food, skills, culture, ecological reserves and the capacity to repair and rebuild through successive generations.
The supplied PDFs record different thought experiments and earlier LLM responses. They supply design history and candidate processes. Their numbers and proposed mechanisms require their own evidence. The Aura of Intelligence subterranean cities page supplies the worldwide scope; the Civilisation of Sand city page supplies a city-design workbench. The Micronova and Excursions building page connects energy, water, food, shelter, knowledge and community across several hazard cases. These public pages were checked on 7 November 2026.
Put the population and space together
The public thought experiment uses 100 cubic metres of private dwelling volume per person. Twenty million people therefore require two billion cubic metres of private space. This 7 November calculation adds an editable 200 cubic metres per resident for food systems, industry, services, circulation and shared space. Total: six billion cubic metres. That is 2.4 million defined Olympic swimming-pool volumes, each 50 metres long, 25 metres wide and two metres deep. Structural layout determines the excavation and support actually required.
Construction from 2027 through 2045 provides 19 annual building periods. Six billion divided by 19 is about 316 million cubic metres per year on average. Starting at ten million cubic metres in 2027 requires annual excavation to multiply by about 1.319 to reach the total. The final year's requirement is about 1.46 billion cubic metres. This is a growth rate solved from the design target. Excavation, permanent lining, fit-out and operating life support each need a delivery programme.
At the same space allowances, capacity for 100 million people requires 30 billion cubic metres, averaging 1.58 billion annually over 19 years. This is a complete new habitat-capacity test. Population growth and relocation determine who uses that capacity. Australia's ABS estimate for 31 March 2026, released 17 September, was about 27.92 million. Reaching 100 million would add about 72.08 million people. At 2.5 residents per home, that increase alone requires 28.83 million additional occupied-dwelling equivalents, roughly 1.52 million annually over the selected 19 building years. The 20-million-person city fits within the national programme; it is not added to the national population again.
Close each loop and size its power
For the city, 200 litres circulated per resident per day equals 1,460 gigalitres annually. At a chosen 99.5 per cent recovery, makeup is 7.3 gigalitres annually. Changing recovery to 99 per cent doubles makeup to 14.6 gigalitres. These 7 November design tests concern the entered water circuit. Food, nutrients, process chemistry, leaks and stored reserves need explicit balances. Closed-loop operation is a performance target for each stream.
Food is a major power variable. At 2,500 kilocalories per person per day, edible food carries about 2.91 kilowatt-hours of chemical energy. A chosen five per cent electricity-to-edible-energy conversion requires about 58.1 kilowatt-hours of electricity per person per day. For 20 million people that is 48.4 gigawatts continuously. Another 1,000 watts per resident for other city services adds 20 gigawatts. Total: 68.4 gigawatts average, or 599 terawatt-hours annually, about 2.1 times Australia's 2025 electricity generation. Five per cent is an editable research target dated 7 November 2026. Crop yields, nutrition, lighting, microbial food, recovered nutrients and process losses determine actual performance.
At ten per cent conversion, the same food-energy target and other services need about 44.2 gigawatts in total. At two per cent, they need about 141 gigawatts. Better processes therefore change the industrial requirement substantially. Surface-assisted food and light can reduce normal electricity use; the sealed operating case sizes independent supplies. Electricity used inside ultimately becomes heat unless energy leaves in products or storage. Food produced from that electricity is counted once. Heat rejection needs a continuing route out of the habitat. Aquifer storage and long-term heat disposal have different capacities.
Optimise the industry around available atoms
Australia's October 2026 mineral tables record 961 million tonnes of iron ore, 102.5 million tonnes of bauxite and 730,000 tonnes of contained mined copper in 2025. Processing gives a different picture. The USGS Australian production table, data available through 24 March 2026, records 433,500 tonnes of refined copper in 2024 when electrowon and other primary refining are combined. The Australian Aluminium Council reports 1.57 million tonnes of primary aluminium in 2025. The World Steel Association data updated 28 July 2026 records 5.223 million tonnes of Australian crude steel for 2025. These are dated output benchmarks. Allocation, additional plant, energy and qualified feed determine what a new programme receives.
For a transparent material test, allocate ten per cent of each processing benchmark to robots and apply 95 per cent net manufacturing yield. At six kilograms of copper, 21 of aluminium and 20 of steel in each finished machine, the copper account supports about 6.86 million robots annually; aluminium about 7.10 million; steel about 24.81 million. Together, those three accounts support the smallest figure, 6.86 million. The allocation is a scenario choice. City infrastructure, power equipment, existing customers and exports need their own accounts. Motors, chips, batteries, other materials and factory capability also require supply.
For 100 million robots annually at the same intensities and yield, factory feed needs about 632,000 tonnes of copper, 2.21 million tonnes of aluminium and 2.11 million tonnes of steel. If robots receive ten per cent of national processing output, the corresponding total outputs are 6.32 million, 22.1 million and 21.1 million tonnes annually. Increasing allocation or reducing material intensity reduces those totals. This turns the ambition into specific processing, procurement and power requirements. It does not impose today's output as a permanent ceiling.
Excavated sand belongs in the same mass balance. At 35 per cent pore volume, grain density of 2.65 tonnes per cubic metre and pore-water density of one, the six-billion-cubic-metre city handles about 10.34 billion tonnes of dry solids and 2.1 billion tonnes of pore water. Suitable tested streams could supply structural products, glass, ceramics, thermal stores and recovered minerals. Assays, recovery, purity, structural qualification and manufacturing energy determine the usable products. Sand does not supply every element. Substitution research can improve the design while each process retains a stated performance target.
Let useful work build the next stage
Start with transport, water, repair and material-processing projects that improve daily life. Manufacture machines that help expand clean power, excavation, processing and further manufacturing. Replicate accepted production cells and repair systems across independent owners. Measure useful task hours, intervention rates, wear, energy per task and the time from a verified improvement to a qualified production change. These measures connect quantity with quality and rapid evolution.
The target remains joyful responsible abundance: lives people choose to keep living, with functioning communities and the ability to disconnect. Individual Auras are owner-directed software. The Web3 sensorium connects the intermediary layer. The physical missing middle supplies locally governed racks, power, workshops and civic machines. Purple Party for Australia, or P4A, is the proposed civic layer. GAJRA Earth, the Global Association for Joyful Responsible Abundance on Earth, supplies the proposed international setting. The 2045 city calculator exposes the first volume, growth, water, food-energy and metal-allocation calculations, dated 7 November 2026.
Published population and electricity benchmarks
The 2025 Population Statement, published in January 2026 and corrected in March, projects about 31.5 million people at 30 June 2036. The ABS June 2025 population estimate was 27.6 million. Using those rounded figures, Australia needs to serve another 3.9 million people, an increase of about 14 per cent over eleven years. Those people need housing, water, health care, transport and reliable power across existing cities and towns.
At a chosen 2.5 residents per additional dwelling, 3.9 million people imply 1.56 million additional occupied-dwelling equivalents by 2036. This 7 November calculation isolates population growth; existing shortages, demolitions, household changes and vacancies add their own requirements. It sits alongside the separate National Housing Accord target of 1.2 million homes over five years to June 2029. The 21 August 2026 housing council report recorded 244,000 dwellings under construction in March and expected the 1.2 million total to be reached in late 2030. Factory-made building components, civic construction machines, surveying, plumbing and maintenance are practical capacity opportunities.
Electricity and industrial equipment
AEMO's 25 August 2026 electricity outlook projects underlying annual consumption in the National Electricity Market rising from 204.2 terawatt-hours in 2025 to 2026 to 308.4 in 2035 to 2036. That is another 104.2 terawatt-hours, or 51 per cent. Underlying consumption includes electricity supplied by customers' own generation. Grid-delivered consumption rises from 175.7 to 249.4 terawatt-hours, another 73.7. These figures cover the eastern and southern interconnected market; Western Australia, the Northern Territory and other isolated systems require their own plans.
Population growth alone therefore understates the industrial opportunity. The published demand path includes electrification and emerging industry. Australia can supply switchboards, transformers, cables, towers, solar mounting, power electronics, batteries, water systems and the machines that install and service them. The 80.9 gigawatts in AEMO's October 2026 connection process, recorded in the applications section, provides a dated list of prospective customers to examine. Suppliers need the project's location, approval status, required equipment and delivery date before sizing a factory.
Start with useful work and existing Australian capability
Australia already builds robots. The Clean Energy Finance Corporation's October 2025 case study records A$7 million committed to SwarmFarm, a Toowoomba manufacturing facility and about 200 robots then deployed in Australia. The Australian Renewable Energy Agency's project commencing 12 October 2026 supports Luminous Robotics establishing Melbourne manufacturing and scaling robots for utility-scale solar construction. These are foundations for further capacity.
The May 2024 National Robotics Strategy reported about A$18 billion of Australian robotics-company revenue in 2021. That historical figure covers a broad industry, rather than a measured humanoid production line. Queensland's manufacturing hub network, checked 7 November 2026, provides regional connections for firms that need fabrication, automation and supplier capability.
Initial civic orders could cover solar construction and maintenance, farm work, inspection, moving materials, water and stormwater maintenance, public-space care and emergency logistics. Select machines against demonstrated tasks. Wheeled platforms, industrial arms and specialist field robots can enter service alongside humanoid designs. Specify repair manuals, replaceable parts, local operating authority, interoperable interfaces and continuing access to the machine's data and controls when buying the equipment.
Tesla is already building the production system
Tesla's 22 April 2026 update described a Fremont Optimus line designed for one million robots annually and a Texas second-generation line designed for a long-term ten million annually. Its 21 October 2026 update reports production starting on Fremont's high-volume lines, classifies California as early ramp and Texas as construction, and leaves the Optimus capacity cells blank. The million and ten-million figures remain design ambitions. The October filing supplies a newer construction and production status.
Tesla's corporate Texas page, checked 7 November 2026, describes more than ten million square feet of existing factory floor, roughly 929,000 square metres, on 2,500 acres of land. That floor area describes the broader vehicle manufacturing facility. The Optimus portion of Fremont's converted Model S and Model X space is not separately sized in the reviewed updates.
In a 5 November 2026 construction report, drone observer Joe Tegtmeyer describes the new Texas Optimus building as exceeding seven million square feet, with substantial sections using four floors. Seven million square feet converts to about 650,000 square metres, or 65 hectares of total floor space across its levels. This is a reported construction-area benchmark, not a Tesla-certified floor schedule. The source is the observer's own account reproduced by an X web viewer. The calculator makes the area editable. The same observer expected limited production late in 2027 and a larger ramp through 2028; Tesla's October update supplies no completion date for the Texas factory.
Those quantities show the scale of the industrial race. The reviewed Tesla disclosures do not itemise an Optimus-only capital budget. Australian costs below are therefore built from Australian construction rates and a separate equipment ledger. They do not allocate Tesla's whole-company capital spending to one robot plant.
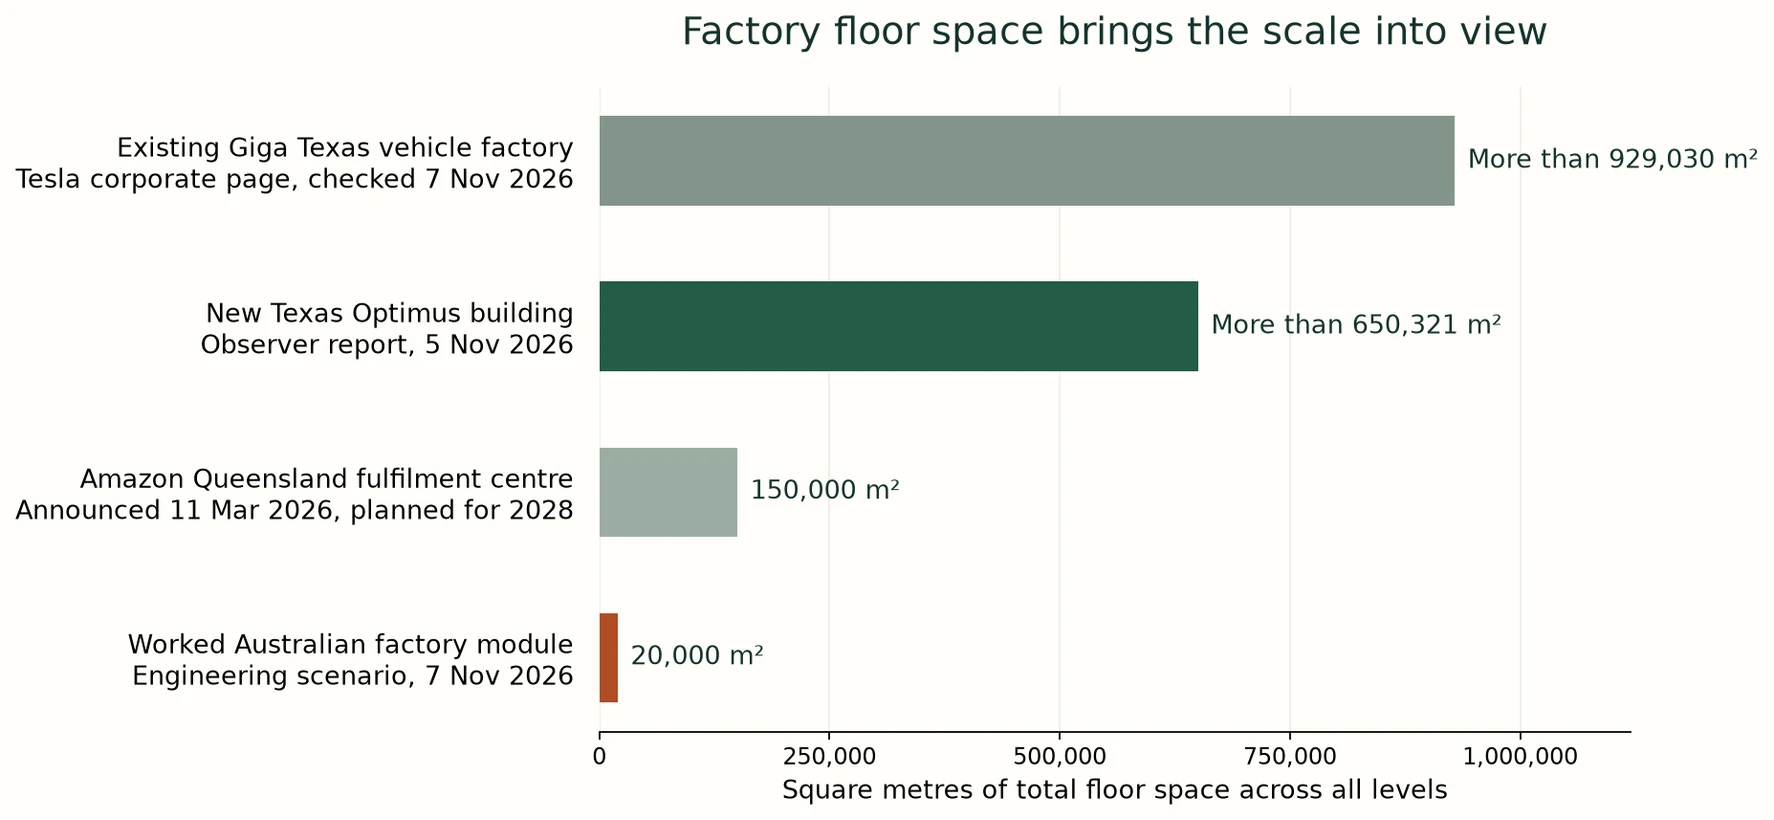
Put Australian floor space and costs beside the ambition
Rider Levett Bucknall's 2026 Queensland cost table, page 16, prices a 4,500 square metre, six-metre-clear industrial building in Brisbane at A$1,360 to A$1,800 per square metre with metal cladding, at fourth-quarter 2025 rates. That gives A$6.12 million to A$8.10 million for the building contract. Land, site works, fees, GST and special production equipment need separate allowances. Larger factories below use a linear first-pass application of that building rate, with their other costs itemised.
A local reference for the scale of a fitted automated building is Amazon's 11 March 2026 Queensland announcement: more than A$750 million for a planned 150,000 square metre robotics fulfilment centre across four levels, intended to finish in 2028. Its investment and floor area imply more than A$5,000 per square metre across that project. It provides a local capital comparison; the manufacturing model uses its own building, land, services and equipment quantities.
The worked Australian factory module has 20,000 square metres of total floor space. Picture a rectangle 200 metres long and 100 metres wide: two hectares under one roof. Five hectares of land allows 40 per cent site coverage, leaving room for access, freight, outside services and expansion. Of the enclosed floor, 5,000 square metres is reserved for stores, support, engineering and other fixed functions.
At the worked rates, the module contains A$32 million for its building, A$12 million for factory services, A$36 million for production and test equipment, A$7.5 million for site works, A$12.5 million for land, and A$17.5 million for design fees and contingency. Total: A$117.5 million per module, in constant late-2025 Australian dollars. Only the building rate is tied to the quantity-surveyor range. The other amounts are editable engineering allowances dated 7 November 2026. The national programme also carries a separate A$100 million shared engineering allowance.
A smaller 4,500 square metre option, reserving 1,500 square metres for support, costs A$26.4 million under the same rates and allowances. A 50,000 square metre option, reserving 10,000 square metres for support, costs A$293.8 million. These comparisons expose the space and equipment choices. A reused building needs its own purchase or lease and refurbishment budget.
Translate the Tesla benchmark into a testable local hypothesis
Ten million robots divided by the reported 650,000 square metres gives roughly 15.4 robots per square metre per year at Tesla's intended mature scale. The modest Australian worked case uses one quarter of that throughput per productive square metre, then applies a 75 per cent achieved-output factor. The 20,000 square metre module has 15,000 productive square metres. Its resulting annual output ceiling is about 43,250 robots. This is a 7 November 2026 engineering hypothesis, not observed Australian or Tesla production performance.
The calculator lets readers change the reference floor area, reference production target, Australian throughput, achieved output and support space. It then limits annual manufacture to the factories scheduled to be available. A larger sales or production ambition appears as an unmet factory requirement until the physical capacity is added. Components, skills, power, validated designs and committed buyers must also support the production schedule.
Domestic use and exports grow together
The modest manufacturing ambition starts at 5,000 robots in 2027, multiplies annual manufacture by 2.5 through 2031 and by 1.6 thereafter. Factories begin at one module and grow by a multiplier of 1.5 each year, rounded up to complete modules. Export allocation is 35 per cent; 65 per cent stays in Australia. Permanent fleet losses use the paper's repair-preserving assumptions. Every figure in this programme is a conditional 7 November 2026 scenario.
In 2032, eight modules provide 160,000 square metres of enclosed floor. They support the scenario's 312,500 robots manufactured that year: 203,125 for domestic use and 109,375 for export. Earlier domestic batches leave about 412,000 machines in service by that year. The construction and shared engineering account totals A$1.04 billion. Three months of working capital at A$35,000 variable production cost per robot requires another A$2.73 billion. Buildings and production cash are separate funding needs.
In 2036, the same factory ramp reaches 39 modules and 780,000 square metres of total floor space. It supports about 1.687 million robots manufactured that year, against a 2.048 million ambition. Meeting the full ambition at the selected throughput requires 48 modules, nine more than scheduled. The supported batch supplies about 1.096 million domestic robots and 590,000 exports. Earlier batches leave about 3.059 million domestic machines operating, against a 3.15 million service requirement at one robot per ten residents.
The 2036 construction and shared engineering account totals A$4.68 billion. Working capital adds A$14.76 billion under the three-month assumption. At the illustrative A$50,000 factory sale price, that year's exports represent A$29.52 billion of gross sales. At A$35,000 variable production cost and 60 per cent Australian production spend, the complete domestic and export batch directs about A$35.42 billion to Australian production inputs. These are sales and spending measures, not profit or gross domestic product.
Increasing the factory rollout multiplier from 1.50 to 1.54 reaches 49 modules by 2036 and covers the 2.048 million annual production ambition under the same productivity assumptions. That faster path leaves about 3.4 million domestic robots operating by 2036 and supplies 716,800 exports in that year. The extra physical capacity changes the result. The calculator shows its extra construction funding and working capital beside it.
Make the missing middle a durable domestic customer
At 3,000 locally governed service catchments, the slower worked path's 2032 domestic fleet averages about 137 robots per catchment; its 2036 fleet averages about 1,020. Those machines can work across surrounding homes, farms, utilities and public spaces. They need local workshops, trained crews, parts inventories, software continuity and independent repair businesses. The racks and workshops support their work; they do not place the entire fleet under one remote command.
At 250 watts average wall power per operating robot, the 2036 domestic fleet needs about 6.70 terawatt-hours annually. Factory assembly and testing add about 0.84 terawatt-hours at an assumed 500 kilowatt-hours per machine produced. Upstream metals, chips and component manufacture require their own inventories. New generation, storage and network connections must meet this programme alongside fossil replacement and essential development. Robots that help build and maintain clean energy are part of the delivery capacity.
Begin with domestic service contracts and qualified production batches. Grow Australian manufacture of frames, wiring, control boards, battery packs, joints, sensors, tools and repair modules as those processes are proven. Secure diverse imported components while expanding local production and recoverable inventories. Procurement can preserve owner-held keys, local data, documented interfaces, physical isolation and the ability to disconnect.
Export machines, modules and service knowledge on terms that preserve the buyer's authority. GAJRA Earth, the Global Association for Joyful Responsible Abundance on Earth, provides Hayes's proposed international setting for that reciprocal capability. The aim is a growing network of capable communities and countries. Australia's opportunity is to become a manufacturer, designer, repairer and exporter with its own domestic productive base as the global industry grows.
Mineral processing and component exports
The global copper case above adds 12.4 million to 14.1 million tonnes of annual end use between 2025 and 2036. Supplying one per cent of that increase would mean 124,000 to 141,000 tonnes of additional copper delivered annually. As a contained-metal comparison, that equals 17 to 19 per cent of Australia's 2025 mine output. The one per cent share is an illustrative sales target, with further processing and recovery needed for the chosen product. It could support expansion in mines, refined copper, conductors and finished electrical equipment, backed by actual buyers.
The September 2026 Resources and Energy Quarterly forecasts copper export earnings rising from 14 billion Australian dollars in 2025 to 2026 to 19 billion in 2030 to 2031, on its stated real-dollar basis. It projects Australian lithium mine output growing about 8.8 per cent annually to 2031, while global lithium demand grows more than eleven per cent. Its aluminium outlook also identifies AI and energy investment as demand drivers. These are nearer-term official market signals to compare with the larger 2036 scenarios.
Australia can pursue refined products, qualified robot modules, repair systems and complete machines alongside ore sales. Rare earth separation, motor manufacture and alternative magnet production offer further processing stages. Regional power and water equipment can serve neighbours' development needs. Each step needs competitive power, water, skills, qualified output and customer agreements. Public and community participation can secure domestic access and diversify ownership as exports grow.
Build against accepted output and service records
Start with a consortium of domestic buyers, qualified designs, industrial premises and independent service crews in 2026 and 2027. Scale production against accepted batches, secure component supplies and confirmed power. Use Brisbane 2032 to establish useful community capability that continues after the Games. The 2036 objective is a durable Australian manufacturing and repair base, supplying domestic owners and export customers through distributed authority. The Australian manufacturing page provides the factory and delivery calculators. These are recommendations dated 7 November 2026.
Sovereignty and the global missing middle
The United States and China are the principal industrial forces in this analysis. China's national programmes and the United States' government-backed and corporate programmes mobilise energy, chip production and manufacturing at a scale that affects other countries' choices. The 23 July 2026 Chinese energy plan and the 20 April 2026 US infrastructure determination illustrate the state role. Large founder-led business networks also mobilise corporate spending, investor finance and supply commitments across connected industries.
Australia enters this competition with substantial material leverage. The October 2026 Geoscience Australia tables place its 2025 shares at about 37 per cent of world iron ore output, 23 per cent of bauxite and 38 per cent of lithium. Its roles differ by material and processing stage. The capacity comparisons above show where additional domestic refining and manufacture could strengthen its position.
The objective proposed here is Australian authority over its resources and supply decisions, including the ability to negotiate between major customers and withstand coercion from any country. It includes physical defence: protecting mines, processing plants, ports, power systems, communications and transport against attack or seizure, while maintaining essential production and services during disruption.
Supply agreements can support that authority through diverse customers, domestic processing, reliable civilian access and investment in Australian skills and infrastructure. A defence and industrial strategy should address attempted coercion by the United States, China or any other state on the same principle of Australian self-determination.
Hayes's proposed defence is a distributed missing middle: civic robots, workshops, manufacturing capability, power and shared computing owned and governed across people and communities. A single organisation does not command the whole network. Civic machines can maintain infrastructure, move supplies, support food and health services and repair the systems on which national continuity depends. Owners and communities retain operating authority while coordinating agreed work.
A Fair Go in the Age of Superintelligence, checked on 5 November 2026, connects national capability with postcode-level sovereign compute. Its racks are physical infrastructure. Aura of Intelligence is Hayes's proposed personal software. Each individual Aura can use that shared capacity under its owner's authority. The Web3 sensorium is the proposed intermediary layer; Purple Party for Australia, or P4A, is the proposed civic layer for informed grassroots participation and constitutional change.
Domestic component manufacture, repair workshops and shared computing help people retain useful capability. Owners need compatible parts, control of records and the ability to connect or disconnect. The same industrial base can support hospitals, science and civilian infrastructure or military equipment. Public investment can secure transparent supply commitments and accountable control as production expands.
The same missing middle is intended to grow globally. GAJRA Earth, the Global Association for Joyful Responsible Abundance on Earth, provides the public framework for that wider proposal. Communities in many countries would build and govern their own useful capacity while sharing knowledge and coordinating chosen projects. Hayes describes this as the world balancing itself through distributed capability. Australia is one participant in that network, and its national self-defence sits within a wider aim of personal and community sovereignty.
In that proposal, joyful, responsible and abundant are held together: people have worthwhile lives, take responsibility for their effects on others and expand the capacity to meet needs. The quantitative question remains concrete. How many civic machines, workshops, power systems and processing plants can communities actually obtain, maintain and govern? The material and capacity comparisons in this paper identify the industrial scale from which to plan that distributed buildout.
Hayes also expresses this purpose through A Protopian Gambit and its songs We Go Beyond and Joyful Responsible Abundance. The invitation is to build a world people want to participate in, with room for exploration, enjoyment and responsibility towards others. Civic robots, personal Auras and shared infrastructure serve that life. The three values guide choices about what machines do, who gains access and who is affected.
Calculation record
All calculations in this rewrite are dated 7 November 2026. The robot production paths originated on 5 November. Reported observations and targets retain their source dates. Narrative quantities are rounded from unrounded calculations.
The delayed robot scenario starts at 100,000 units in 2027, grows 50 per cent annually through 2031 and then 25 per cent annually through 2036. The replicated scenario starts at 500,000, doubles annually through 2031 and then grows 50 per cent annually. The accelerated scenario starts at one million, multiplies by 2.5 annually through 2031 and then grows 60 per cent annually. It reaches 62.5 million in 2032, 100 million in 2033 and 409.6 million in 2036.
Annual batch mass equals robots manufactured multiplied by kilograms per robot. The unrounded 2031 accelerated count is 39,062,500. Multiplying by 60 kilograms gives 2,343,750,000 kilograms. Accumulated manufactured mass sums each year's batches. The in-service stock separately deducts observed final retirements.
Market-demand calculations use separate end-use, primary and secondary accounts. Copper uses S and P Global's rounded January 2026 points of 28, 33, 38 and 42 million tonnes in 2025, 2030, 2035 and 2040, with straight interpolation between points. The accelerated robot addition is finished copper in that year's new batch. Factory procurement and primary ore are calculated separately. The main four-sector market total is treated as excluding the separately illustrated humanoid manufacturing scenarios.
Aluminium uses McKinsey's July 2025 demand series of 106 to 130 million tonnes, primary supply of 73 to 78 million and secondary supply of 32 to 48 million from 2025 to 2035. Each series is interpolated at its own compound rate, then extended one year to 2036. This gives demand growth of about 2.06 per cent, primary pipeline growth of 0.665 per cent and secondary pipeline growth of 4.14 per cent annually. The robot addition to end use is finished metal; its factory procurement uses 95 per cent yield. Additional primary and secondary feed is split equally in the half-secondary case. The base-market gap can be filled by either source. Humanoid demand is an additional scenario allowance because the published outlook does not identify its humanoid component; any subsequently identified allowance must be deducted before adding the robot inventory.
All-cause fleet sensitivities apply an annual final-retirement fraction to each cohort: surviving units equal that year's new units multiplied by one minus the fraction, raised to the number of years before 2036. New end-year batches have zero earlier exposure. Accident reductions of 90 and 99 per cent are independent illustrative inputs and are not calibrated to injury rates. Longer-life design hypotheses do not impose a calendar disposal date or automatically release useful equipment as scrap.
The Australian population comparison uses rounded estimates of 27.6 million in June 2025 and 31.5 million in June 2036. Additional dwellings equal additional people divided by 2.5 residents. The civic service requirement is 0.1 robot per resident. Manufacture starts at 5,000 robots in 2027, multiplying by 2.5 annually through 2031 and by 1.6 thereafter. Each year, supported output is the smaller of the manufacturing ambition and commissioned factory capacity. Exports take 35 per cent, while the domestic share enters repair-preserving surviving cohorts. The separate one per cent copper export target applies only to added global copper end use between 2025 and 2036.
Australian module output equals productive floor area multiplied by the Tesla target-to-reported-area ratio, the chosen Australian productivity factor and achieved output fraction. A module's capital includes its building, services, equipment, land, site works, design fees and contingency. New modules enter the construction account in their commissioning year. Shared engineering is added once. Working capital equals current annual output multiplied by variable unit cost and financed months divided by twelve. It remains a separate current cash requirement. Sales and production spending are calculated independently. All financial figures use constant late-2025 Australian dollars; the editable real factory cost multiplier is one in the worked case.
Annual finished-material demand equals new units multiplied by material per unit, plus new material supplied for the scheduled service jobs. External factory feed equals finished material divided by net manufacturing yield. New primary material equals external feed multiplied by the share supplied from primary sources. Factory scrap already recirculated within net yield is counted once.
Primary ore equals primary material divided by ore grade, chemical conversion where needed and recovery to the specified product. Copper uses 0.005 grade and 0.85 recovery. The bauxite example uses four tonnes per tonne of primary aluminium. Rare earth ore uses 0.05 total oxide grade, a 0.20 NdPr oxide share, 0.857 metal content and 0.75 recovery. Each is a reference process requiring project-specific validation.
The three ground-computing energy rates are the compound rate connecting 485 to 950 terawatt-hours over five years, 20 per cent and 30 per cent annually. Each is applied from 2025 through 2036. Rated computing gigawatts equal annual terawatt-hours divided by 8.76 hours-to-energy conversion, 1.2 facility overhead and 0.8 average computing load. Annual net addition is the change in rated capacity between years.
Reference rack mass uses 3,245 pounds converted at 0.45359237 kilograms per pound and a 120 kilowatt rack rating. Rack-base mass multiplies rated capacity by this mass per gigawatt. Annual construction mass multiplies the net capacity increase by the same factor. Actual upgrades and replacement components are added from their specified service programme.
The orbital annual run-rate inputs are zero at the end of 2026, one gigawatt at the end of 2027, ten in 2028, 100 in 2029, 200 in 2030 and 300 from 2031 onwards. Actual commissioning within each year uses the mean of its starting and ending run rates. Commissioned gigawatts multiplied by 10,000 tonnes per gigawatt gives payload manufactured. Accumulated commissioning sums annual completed quantities.
Solar annual energy equals rated capacity multiplied by capacity factor and hours in the year. Silicon mass follows cell area, thickness and density. The orbital example uses 1,363.4 watts per square metre of incident sunlight; the ground panel example uses a 1,000 watt-per-square-metre rating condition. Radiator area follows rejected heat, emissivity and the Stefan-Boltzmann relation at 320 kelvin. Power-beaming source output equals delivered electricity divided by end-to-end efficiency.
Train equivalents divide mass by the reported 28,000 tonne Pilbara payload. The defined swimming-pool space is 50 times 25 times two metres, or 2,500 cubic metres. Solid-metal volume divides tonnes by density in tonnes per cubic metre. Country-electricity comparisons divide annual energy by Australia's 286.8 terawatt-hours in 2025.
Robot, ground-computing, orbital and power-supply modules can be combined only after their project boundaries are matched. Electricity used in orbit is supplied in orbit. A generation plant serves its allocated loads once. The power-system examples size selected designs; the final combined mining requirement needs complete project inventories for structures, networks, chip factories, processing plants and service parts as well as the quantified materials here.